My First Kernel Module: A Debugging Nightmare
This is the story of the time I wrote some code, deployed it to production, and ended up bricking the server it was running on by frying the kernel.

Spoiler alert: This is a story about perils of concurrency and race conditions. My code was nearly correct, but ultimately, there were two major synchronization bugs that killed it.
This blog post gets into the weeds at times, but if you aren’t very familiar with the Linux kernel, I think you will find it an informative story in how Linux keeps track of information under the hood, as well as how it uses lock-free programming techniques for synchronization when high performance is needed. It’s also a painful story in how not to deploy code to production :)
In this post, I assume you have some understanding of how files and concurrency work on Unix systems. I will try to explain everything else!
A nightmare begins
I have been working on building a graphical debugger for C Playground for some time, allowing users to run code in the browser and visualize how their program is being executed. As part of this work, I had to implement a kernel module. (I’ll explain more about this project in the next section.) After testing the code locally for a few months, I pushed it to production.
The next morning, I woke up to a text from my roommate: “I think the server crashed.” Uh oh, that’s not supposed to happen. I quickly pulled out my laptop and tried to SSH into the server to pull the logs, but to my surprise, I couldn’t reach the server:
ssh: connect to ... port 22: Operation timed out
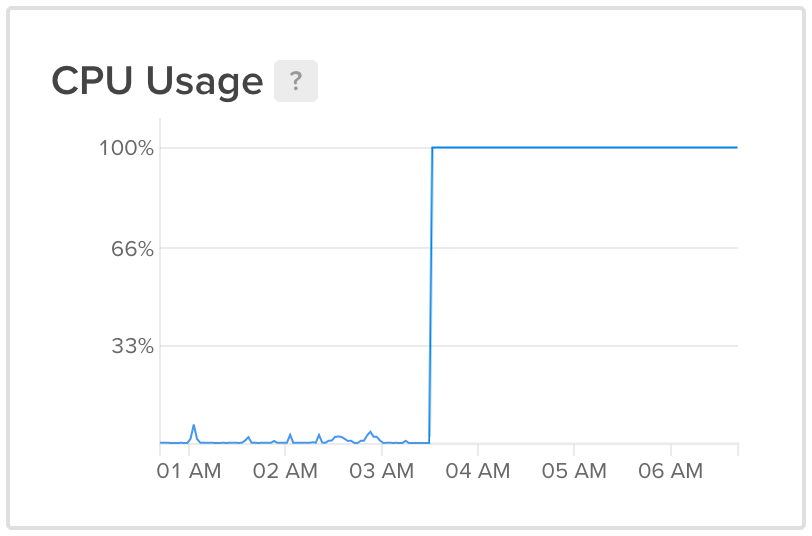
Something wasn’t right. I logged into DigitalOcean to restart the machine, but while I was doing that, I noticed a spike in the server’s CPU usage graph around the time my roommate texted me. The CPU was cleanly pegged at 100%. Normally, if a process running on the machine is hogging the CPU, we should expect to see slight fluctuations around 100%, but that was not the case here.
After force-restarting the server via DigitalOcean and rolling back the
debugging feature, I started going through logs to get a sense for what
happened. My kernel module has print statements, and these get saved to the
kernel’s log in /var/log/kern.log. I scanned through this file, hoping to
find some clues, but this only confused me even more; there was nothing in
the kernel logs from any time near when the server locked up. It seemed to
suggest my kernel module wasn’t even running at that time. But I felt it had
to be a problem with my kernel module: nothing in user space could cause a
computer to lock up the way it did, completely unresponsive and pegged at 100%
CPU.
I kept digging. If the kernel logs didn’t give me anything helpful, maybe there might be some application-side records that would indicate what happened. However, when I checked the C Playground log file, I felt things only getting worse:
[2020-03-25T14:47:00-0400] [INFO]   [p5wDiTxoeX4hdYwDAAEm] Websocket connection received from <redacted>
[2020-03-25T14:47:00-0400] [LOG]    [p5wDiTxoeX4hdYwDAAEm] Program is at alias lion-eland-echidna
[2020-03-25T14:47:00-0400] [LOG]    [p5wDiTxoeX4hdYwDAAEm] Run logged with ID 55229
[2020-03-25T14:47:00-0400] [LOG]    [p5wDiTxoeX4hdYwDAAEm] Saving code to /srv/cplayground/data/dfb5e628-595f-464d-a4dd-1559db7b78d8
[2020-03-25T14:47:00-0400] [LOG]    [p5wDiTxoeX4hdYwDAAEm] Successfully created gdb socket at /srv/cplayground/data/dfb5e628-595f-464d-a4dd-1559db7b78d8-gdb.sock
[2020-03-25T14:47:00-0400] [LOG]    [p5wDiTxoeX4hdYwDAAEm] Starting container: docker run -it --name dfb5e628-595f-464d-a4dd-1559db7b78d8 --read-only --tmpfs /cplayground:mode=0777,size=32m,exec -v /srv/cplayground/data/dfb5e628-595f-464d-a4dd-1559db7b78d8:/cplayground/code.cpp:ro -v /srv/cplayground/data/dfb5e628-595f-464d-a4dd-1559db7b78d8-include.zip:/cplayground/include.zip:ro -e COMPILER=g++ -e CFLAGS=-g -std=c++17 -O0 -Wall -no-pie -lm -pthread -e SRCPATH=/cplayground/code.cpp --cap-drop=all --memory 96mb --memory-swap 128mb --memory-reservation 32mb --cpu-shares 512 --pids-limit 16 --ulimit cpu=10:11 --ulimit nofile=64 --network none -v /srv/cplayground/data/dfb5e628-595f-464d-a4dd-1559db7b78d8-gdb.sock:/gdb.sock --cap-add=SYS_PTRACE -e CPLAYGROUND_DEBUG=1 cplayground /run.py
[2020-03-25T14:47:00-0400] [LOG]    [p5wDiTxoeX4hdYwDAAEm] Initial terminal size 80x24
[2020-03-25T14:47:01-0400] [LOG]    [p5wDiTxoeX4hdYwDAAEm] Resize info received: 17x74
[2020-03-25T14:47:01-0400] [LOG]    [p5wDiTxoeX4hdYwDAAEm] Resize info received: 17x75
^@^@^@^@^@^@^@^@^@^@^@^@^@^@^@^@^@^@^@^@^@^@^@^@^@^@^@^@^@^@^@^@^@^@^@^@^@^@^@^@
^@^@^@^@^@^@^@^@^@^@^@^@^@^@^@^@^@^@^@^@^@^@^@^@^@^@^@^@^@^@^@^@^@^@^@^@^@^@^@^@
^@^@^@^@^@^@^@^@^@^@^@^@^@^@^@^@^@^@^@^@^@^@^@^@^@^@^@^@^@^@^@^@^@^@^@^@^@^@^@^@
^@^@^@^@^@^@^@^@^@^@^@^@^@^@^@^@^@^@^@^@^@^@^@^@^@^@^@^@^@^@^@^@^@^@^@^@^@^@^@^@
^@^@^@^@^@^@^@^@^@^@^@^@^@^@^@^@^@^@^@^@^@^@^@^@^@^@^@^@^@^@^@^@^@^@^@^@^@^@^@^@
^@^@^@^@^@^@^@^@^@^@^@^@^@^@^@^@^@^@^@^@^@^@^@^@^@^@^@^@^@^@^@^@^@^@^@^@^@^@^@^@
^@^@^@^@^@^@^@^@^@^@^@^@^@^@^@^@^@^@^@^@^@^@^@^@^@^@^@^@^@^@^@^@^@^@^@^@^@^@^@^@
^@^@^@^@^@^@^@^@^@^@^@^@^@^@^@^@^@^@^@^@^@^@^@^@^@^@^@^@^@^@^@^@^@^@^@^@^@^@^@^@
^@^@^@^@^@^@^@^@^@^@^@^@^@^@^@^@^@^@^@^@^@^@^@^@^@^@^@^@^@^@^@^@^@^@^@^@^@^@^@^@
^@^@^@^@^@^@^@^@^@^@^@^@^@^@^@^@^@^@^@^@^@^@^@^@^@^@^@^@^@^@^@^@^@^@^@^@^@^@^@^@
^@^@^@^@^@^@^@^@^@^@^@^@^@^@^@^@^@^@^@^@^@^@^@^@^@^@^@^@^@^@^@^@^@^@^@^@^@^@^@^@
^@^@^@^@^@^@^@^@^@^@^@^@^@^@^@^@^@^@^@^@^@^@^@^@^@^@^@^@^@^@^@^@^@^@^@^@^@^@^@^@
^@^@^@^@^@^@^@^@^@^@^@^@^@^@^@^@^@^@^@^@^@^@^@^@^@^@^@^@^@^@^@^@^@^@^@^@^@^@^@^@
^@^@^@^@^@^@^@^@^@^@^@^@^@^@^@^@^@^@^@^@^@^@^@^@^@^@^@^@^@^@^@^@^@^@^@^@^@^@^@^@
^@^@^@^@^@^@^@^@^@^@^@^@^@^@^@^@^@^@^@^@^@^@^@^@^@^@^@^@^@^@^@^@^@^@^@^@^@^@^@^@
^@^@^@^@^@^@^@^@^@^@^@^@^@^@^@^@^@^@^@^@^@^@^@^@^@^@^@^@^@^@^@^@^@^@^@^@^@^@^@^@
^@^@^@^@^@^@^@^@^@^@^@^@^@^@^@^@^@^@^@^@^@^@^@^@^@^@^@^@^@^@^@^@^@^@^@^@^@^@^@^@
^@^@^@^@^@^@^@^@^@^@^@^@^@^@^@^@^@^@^@^@^@^@^@^@^@^@^@^@^@^@^@^@^@^@^@^@^@^@^@^@
^@^@^@^@^@^@^@^@^@^@^@^@^@^@^@^@^@^@^@^@^@^@^@^@^@^@^@^@^@^@^@^@^@^@^@^@^@^@^@^@
^@^@^@^@^@^@^@^@^@^@^@^@^@^@^@^@^@^@^@^@^@^@^@^@^@^@^@^@^@^@^@^@^@^@^@^@^@^@^@^@
^@^@^@^@^@^@^@^@^@^@^@^@^@^@^@^@^@^@^@^@^@^@^@^@^@^@^@^@^@^@^@^@^@^@^@^@^@^@^@^@
^@^@^@^@^@^@^@^@^@^@^@^@^@^@^@^@^@^@^@^@^@^@^@^@^@^@^@^@^@^@^@^@^@^@^@^@^@^@^@^@
<truncated for brevity>
What on earth is that???
After some Googling, I figured out that ^@ is how less displays null bytes.
So, my log file is filled with null bytes. Why on earth would that be?
Then it occurred to me: Filesystem writes aren’t synchronous. When a program writes to a file, the data is usually not immediately written to disk. Instead, to improve performance, the data is written to a buffer in memory. Normally, the kernel flushes this buffer to disk periodically, so that the data is persisted. But if the kernel is incapacitated, there is no way the data can reach the disk, and when the machine force-restarts, it is lost forever. From the above output, I could see that parts of the logs made it to disk, but later parts of the logs were not so lucky, appearing as scrambled null bytes instead.
I started to feel a sense of dread creeping in. This was reminding me of the extremely late nights and brain-frying debugging sessions from that time I took an operating systems class. Except this might be even worse: This problem is only happening in production, and I can’t reproduce it, and I can’t get any logs to explain what’s wrong.
In the next section, I’ll explain what my kernel module was doing, so that you can follow along with my debugging process. Then, in the last section, I’ll talk you through the long, long process I went through to identify the two bugs that caused this problem. (Spoiler alert: there were two race conditions that caused two use-after-frees, in which I attempted to use memory after it had already been freed.)
Context: C Playground Visual Debugger
I have been working on C Playground for some time, which is an online sandbox for quickly testing out C and C++ code. It is specifically designed for learning systems programming, and I have been working on features that generate diagrams to illustrate what is happening under the hood when you run code on a computer.
Most recently, I was working on generating diagrams of the data structures that
the kernel uses to keep track of a program’s open files. The context and
motivation for this are described in much more detail in this blog
post.
As a very brief summary, this feature aims to help students understand system
calls such as open, close, dup2, fork, pipe, and others. Using these
system calls requires an understanding of what they are doing on your behalf.
Usually, we explain these system calls in terms of the vnode table, which
caches information about files on the system, the open file table, which
stores session information (e.g. program X has file Y open for reading, and
has read 100 bytes so far), and the file descriptor table, which stores
pointers into the open file table indicating which sessions a process has open.
When teaching these concepts, we typically draw a lot of diagrams by hand. C Playground aims to generate diagrams automatically, helping students to build up and confirm their intuitions without needing access to a TA. The platform allows students to set breakpoints and step through their code line by line. On each line, C Playground generates a diagram of the aforementioned tables, like so:
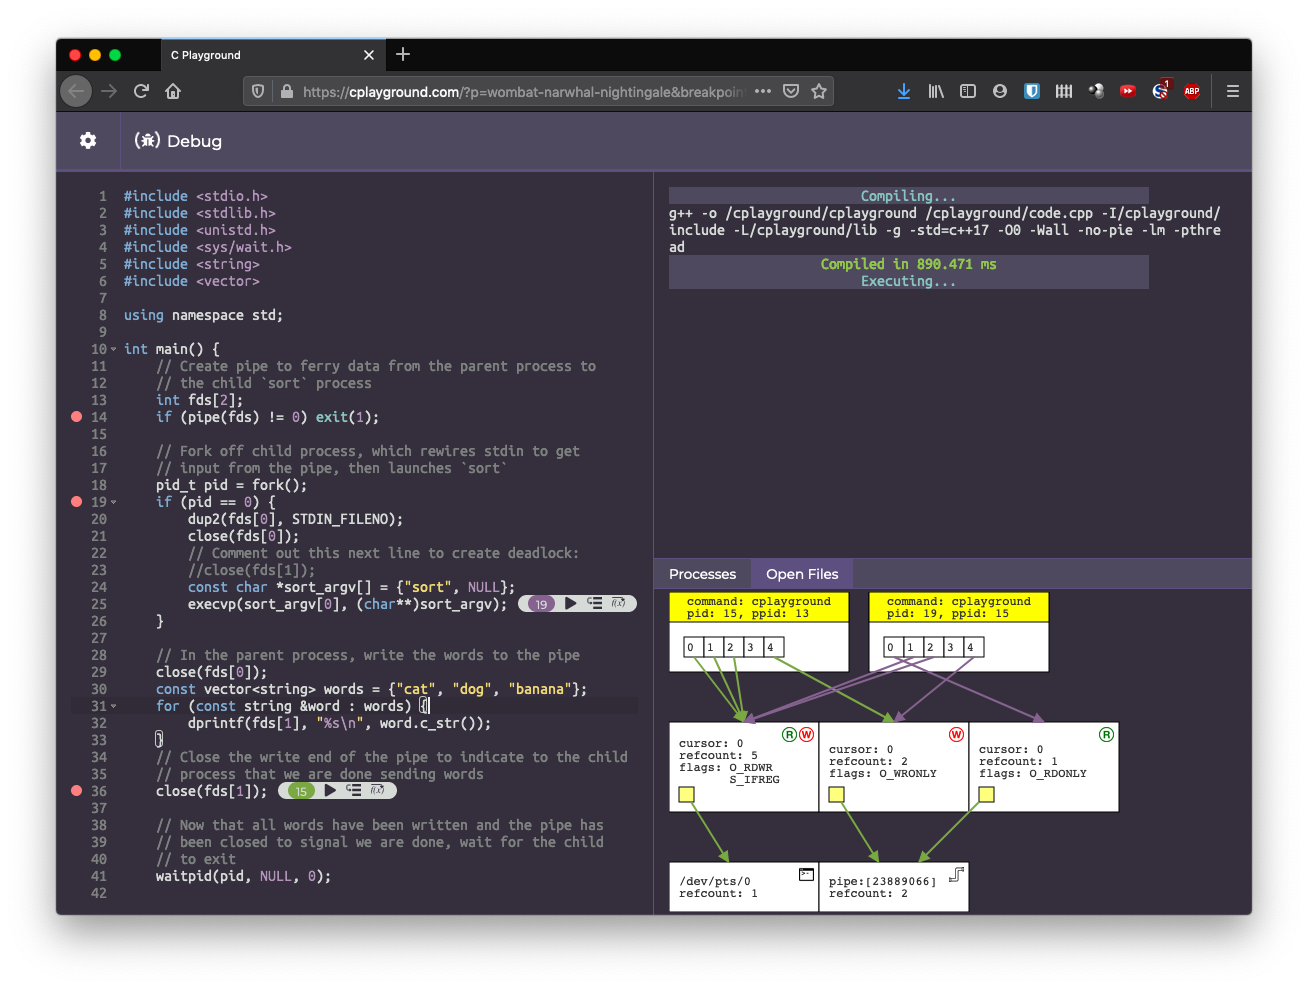
These diagrams help students confirm their understanding of how system calls
work, and they also help students debug code that isn’t working as expected.
For example, the code in the above screenshot spawns sort in the child
process and uses a pipe to send words from the parent process to the child
sort process. However, it hangs, because it is missing a close() call in
the child process on line 23. Because of the missing close() call, the write
end of the pipe is never fully closed, so when sort reads from the pipe, it
thinks there may be more data running, and therefore never exits.
The diagram helps students identify this, as they can visually identify that
the write end of the pipe has not been fully closed.
Unfortunately, the Linux kernel doesn’t have any APIs that expose the data that
is required to generate these diagrams. As such, I needed to modify the kernel
and access the required data in kernel space. As detailed in the aforementioned
blog post,
I wrote a kernel module that creates a virtual /proc/cplayground file;
whenever the NodeJS backend reads this file, the kernel module generates the
file contents on the fly by iterating through and serializing kernel data
structures.

I really wanted to release this feature by the start of Stanford’s spring quarter in early April. The quarter was moved online due to COVID-19, making it extra hard for us TAs to work with students, and making it much harder to draw diagrams during office hours. I really wanted students to have access to this tool so that they would be able to visualize things on their own without needing access to a TA. Hence, the release was rushed a little more than it should have been. Despite that, I never imagined encountering the disaster I ended up facing.
The next few subsections explain how this feature is implemented, so that you can follow along with my debugging. You can skip these sections if you’d like, but they may be helpful to skip so that you understand the basic structure of what my code is doing.
Operating a /proc file
As mentioned, my kernel module creates a
/proc file in order to expose data
from kernel space to user space. I’m using the
seq_file API, which is an awesome
tool for generating proc files that exposes a printf-like interface where the
strings you “print” get “written” to the file. In reality, the proc file is a
virtual file, so we are not really writing to any file on disk. Under the hood,
seq_file is allocating a buffer for the “file” contents; then, any seq_printf
calls append to the contents of the buffer. If the buffer runs out of space,
seq_file allocates a new buffer with double the size and re-runs the code for
generating the file contents.
Here’s how that looks in practice. The kernel module __init function creates
/proc/cplayground, telling the kernel to use seq_file to handle all file
operations:
// Note: code modified for bloggy readability

static int __init cplayground_init(void) {
    // Create the proc file, with the cplayground_file_ops struct dictating how file
    // operations should be handled
    cplayground_dirent = proc_create("cplayground", 0400, NULL, &cplayground_file_ops);
    if (cplayground_dirent == NULL) {
        return -ENOMEM;
    }
    return 0;
}

// Use `seq_file` API functions to handle all file ops (except for `open`, which
// is handled by `ct_open` below)
static struct file_operations cplayground_file_ops = {
	.owner = THIS_MODULE,
    .open    = ct_open,
    .read    = seq_read,
    .llseek  = seq_lseek,
    .release = single_release,
};

static int ct_open(struct inode *inode, struct file *file) {
    // Call `single_open` from the `seq_file` API, telling it to use our function
    // `ct_seq_show` in order to generate the virtual file contents
    return single_open(file, ct_seq_show, NULL);
}
Then, in the ct_seq_show function, we can simply call seq_printf, and any
string we print using that function will show up in the virtual proc file. Not
bad!

/proc/cplayground file format
As someone who primarily does web development, my first instinct was to have my kernel module produce output in JSON format. This probably wouldn’t have been too terrible, but it wouldn’t have been trivial, either. As there are no JSON serialization libraries for kernel space that I know of, I would have needed to produce strings by hand that parse as valid JSON. Instead, I decided to opt for something simpler to generate. My output would take this form:
line containing process info
line containing fd info
line containing fd info
line containing fd info
...
<blank line>
line containing process info
line containing fd info
line containing fd info
line containing fd info
...
More specifically, output should look like this:
<namespace ID> <pid in global namespace> <pid in container namespace> <container ppid> <container pgid> <command/executable name>
<fd number> <close on exec bit> <open file ID> <file position/offset> <flags> <open file path>
<fd number> <close on exec bit> <open file ID> <file position/offset> <flags> <open file path>
...
<blank line>
What’s a namespace? This has to do with how C Playground programs are isolated from each other (and from the host operating system). Every program executed on C Playground runs in its own Docker container. If you aren’t familiar with Docker containers, they are sort of kind of like “lightweight VMs” that use a variety of tricks, including namespaces, to provide isolation. For example, each container has its own PID namespace that it runs in. If it spawns a new process, that process might have PID 4918 in the global namespace, but it might appear as PID 2 in the container’s namespace, even if some other container already has a PID 2 running. In this way, processes run in one container cannot observe or touch the resources (e.g. processes) that are being used by a different container.
Here’s an example output:
0791fb96d681f840b6fcd13eb38b7d159d2ac75fcf04f38ebe9a3b7d3a0597c8	1179	14	12	14	cplayground
0	0	1458ec504828d89f546feab9475b15da1bf2d01c00af28fdaf29805666fec7d6	0	0100002	/dev/pts/0
1	0	1458ec504828d89f546feab9475b15da1bf2d01c00af28fdaf29805666fec7d6	0	0100002	/dev/pts/0
2	0	1458ec504828d89f546feab9475b15da1bf2d01c00af28fdaf29805666fec7d6	0	0100002	/dev/pts/0
3	0	a555b7207e23ce40a5a172b1f0367a39090e58dd23ab468f847494389717ee38	0	00	pipe:[24005915]
4	0	6ca33d7e8f8fe9363291d579507735619dc939cffcff3174fa7cbab9a62c7ed1	0	01	pipe:[24005915]

0791fb96d681f840b6fcd13eb38b7d159d2ac75fcf04f38ebe9a3b7d3a0597c8	1184	18	14	14	cplayground
0	0	1458ec504828d89f546feab9475b15da1bf2d01c00af28fdaf29805666fec7d6	0	0100002	/dev/pts/0
1	0	1458ec504828d89f546feab9475b15da1bf2d01c00af28fdaf29805666fec7d6	0	0100002	/dev/pts/0
2	0	1458ec504828d89f546feab9475b15da1bf2d01c00af28fdaf29805666fec7d6	0	0100002	/dev/pts/0
3	0	a555b7207e23ce40a5a172b1f0367a39090e58dd23ab468f847494389717ee38	0	00	pipe:[24005915]
4	0	6ca33d7e8f8fe9363291d579507735619dc939cffcff3174fa7cbab9a62c7ed1	0	01	pipe:[24005915]
From this, we see there are two processes running in the same namespace ID
(i.e. the same container – they are part of the same running C Playground
program). Within those processes, file descriptors 0, 1, and 2 each point to
the same open file table entry 1458ec504..., which points to /dev/pts/0
(i.e. the terminal). This is the kind of data that we can use to reconstruct a
visual representation of the kernel data structures.
Generating the output
With such a nice API as seq_file, generating our proc file is easy. (Right?)
Here is some pseudocode:
- For each process running on the host:
- Check if the process is running in a separate PID namespace. (Recall that every Cplayground program runs in an isolated Docker container, and Docker containers use PID namespaces – among many other mechanisms – to provide isolation. If the process is not in a PID namespace, it’s a host process that we aren’t interested in.) If the process is not attached to a separate PID namespace, skip this process and move to the next iteration of the loop.
- Print the process’s PID namespace ID, global PID, container PID,
container PPID, container PGID, and command name to the /proc file.
(Note: a “PID namespace ID” is not a thing in Linux. I made it up out of
necessity, so that I could associate processes that were part of the same
running C Playground program. The best way I came up with to create a
namespace ID is to hash the
struct pid_namespaceaddress that the process points to, since every process in a namespace must point to the same struct.) - For each file descriptor in the process:
- Print the file descriptor number, close_on_exec flag, open file ID,
file position/offset, flags, and open file path to the /proc file.
(Note: similar to the PID namespace ID, there is no such thing as an
open file ID in Linux. I just hashed the address of the
struct filethat each file descriptor points to.)
- Print the file descriptor number, close_on_exec flag, open file ID,
file position/offset, flags, and open file path to the /proc file.
(Note: similar to the PID namespace ID, there is no such thing as an
open file ID in Linux. I just hashed the address of the
Seems simple enough, right?
Here was my attempt at an implementation. It’s terrible kernel code. Don’t copy it. It’s a Frankensteinian monster comprised of copy-and-pasted code from twenty different files in the Linux kernel source and Stack Overflow. That said, I thought it seemed like pretty reasonable code that should work (and it very nearly did). Here’s what it does:
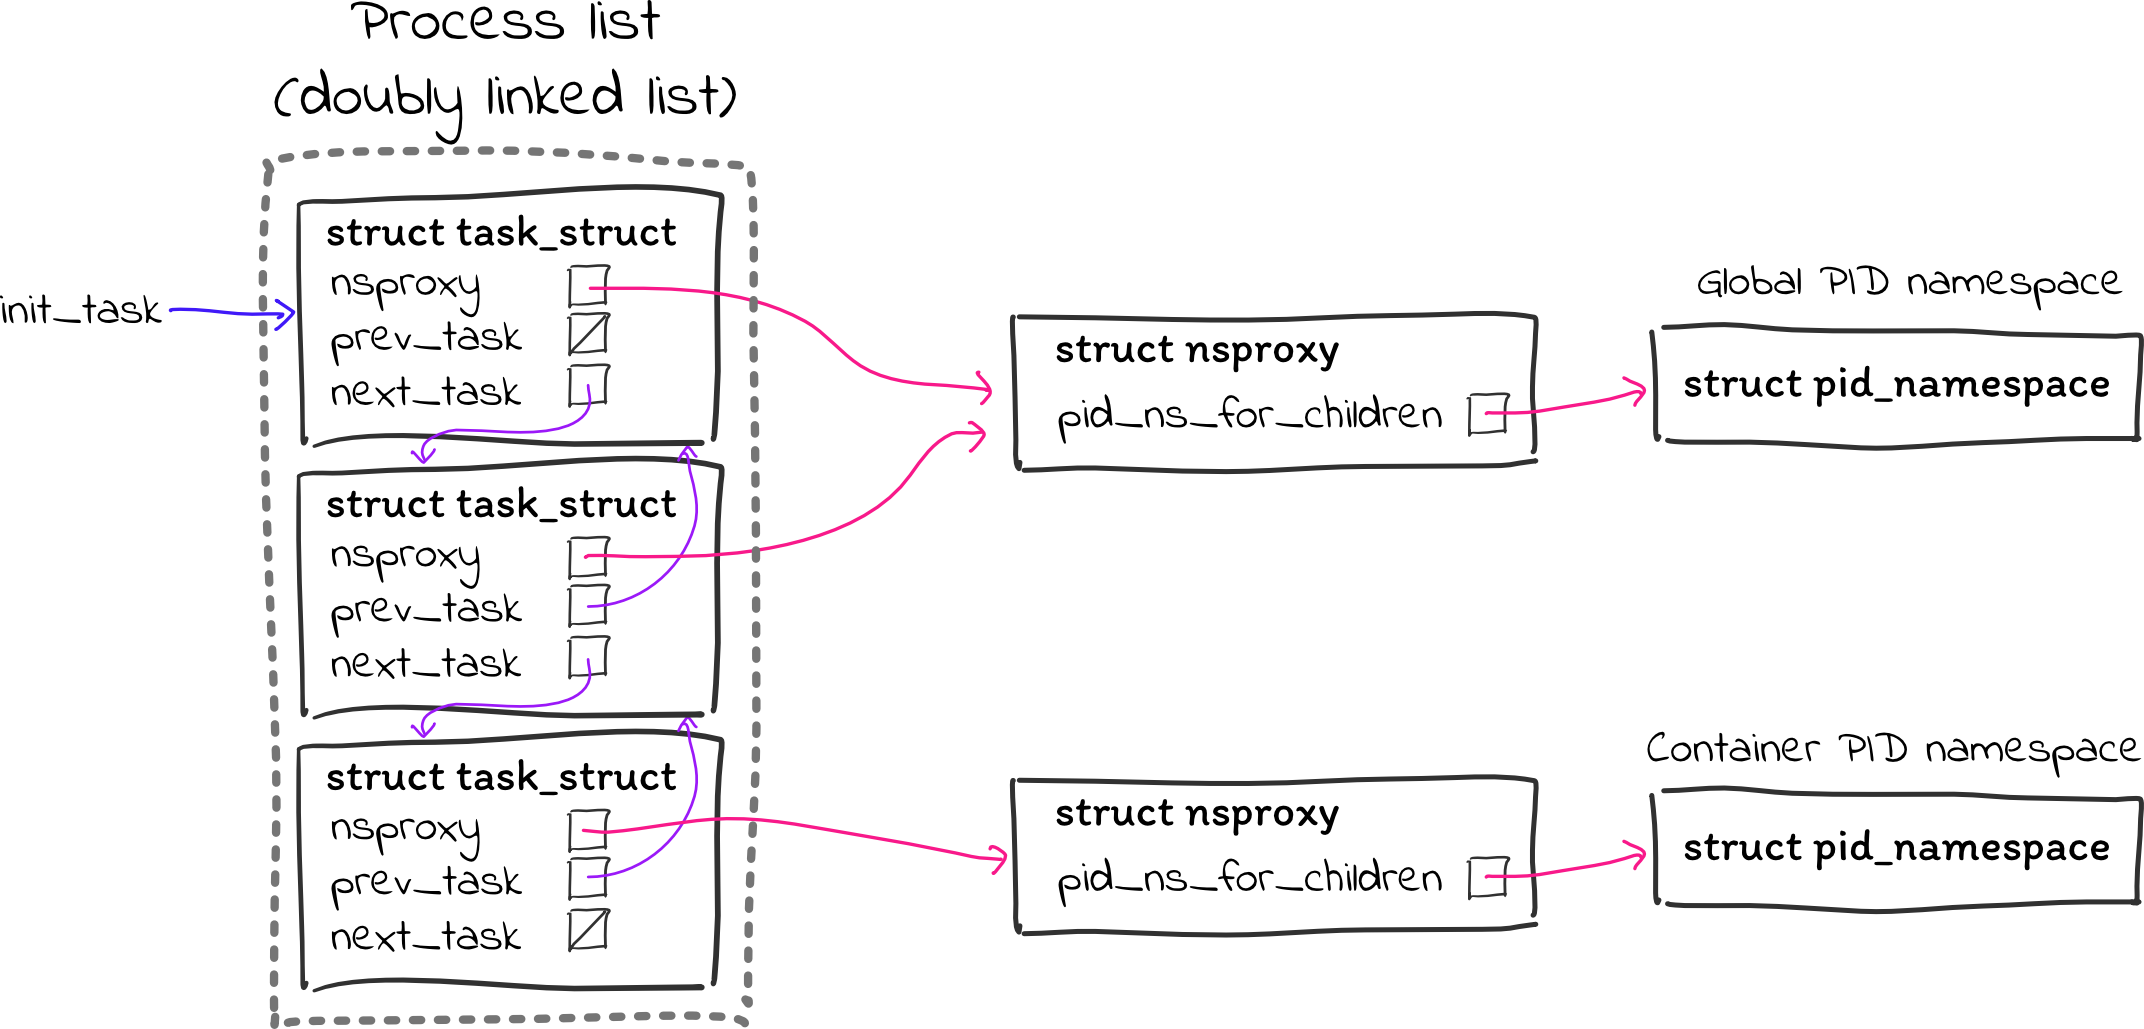
First, in order to be able to tell whether a process is attached to a separate PID namespace, we need to figure out what the address of the global namespace is. Every system will always have an init process (PID 1) running from which all other processes descend, so we can do this by comparing processes’ PID namespaces to that of the init process’s.
The init task_struct is accessible through the global variable
init_task.
(The Linux kernel code refers to processes as “tasks,” so a process’s
task_struct is simply the core struct that stores all the fundamental
information about that process.)
Every task_struct has an
nsproxy field
pointing to a
struct nsproxy
that has pointers for the various types of namespaces that a process can be
associated with (of which PID namespaces are one). As such, we can get the init
task’s PID namespace address as init_task.nsproxy->pid_ns_for_children. (Why
the _for_children? No clue, but it’s the only pid_namespace pointer in
there.)
Every task_struct has a lock in it, and this lengthy and randomly-placed
comment
says we need to lock the task lock before touching nsproxy, so let’s do that
and be race-condition-free:
task_lock(&init_task);
struct pid_namespace *init_ns = init_task.nsproxy->pid_ns_for_children;
task_unlock(&init_task);
Then, we need to loop over each process. The kernel provides a
for_each_process macro for doing this. Nice! We can check each process’s PID
namespace to see if it is containerized:
struct task_struct *task;
for_each_process(task) {
    // Acquire the task lock before touching nsproxy
    task_lock(task);

    struct nsproxy *nsproxy = task->nsproxy;
    if (nsproxy == NULL) {  // indicates zombie process, according to docs
        task_unlock(task);
        continue;
    }
    struct pid_namespace *ns = nsproxy->pid_ns_for_children;
    if (ns == init_ns) {
        // This process is in the global PID namespace. Definitely not
        // a containzerized process.
        task_unlock(task);
        continue;
    }

    // Here be a containerized process. Call a helper function to print this
    // process's details to the /proc file
    inspect_proc(task, ns, sfile);

    // Dobby is a free elf
    task_unlock(task);
}
(Also, why did they name it struct task_struct instead of just struct task?
The world may never know.)
Next, we want to implement inspect_proc to print this task’s information to
/proc/cplayground. The kernel provides a series of inline functions to extract
information about a task (e.g.
task_pid_nr),
and we can use these functions to get most of the information we need. The only
tricky part is printing a namespace ID, so that we can figure out which
processes are in the same container (i.e. comprising the same C Playground
program). As mentioned previously, I wrote a hash function (i.e. copied/pasted
it from the kernel
docs) to hash
the pointer to the struct pid_namespace so that every process in a namespace
will have the same hashed pointer. (Why hash the pointer instead of just
printing the pointer value directly? I felt it didn’t seem like a great idea to
leak kernel addressing information to user space. I don’t know if the kernel
uses ASLR, but if it does, leaking information about where valid memory lies is
not great.)
static void inspect_proc(struct task_struct *task, struct pid_namespace *ns,
        struct seq_file *sfile) {
    char ns_ptr_hash[64 + 1];
    hash_pointer(ns, ns_ptr_hash);

    seq_printf(sfile,
            "%s\t"  // namespace ID (i.e. hash of pid_namespace pointer)
            "%d\t"  // global PID
            "%d\t"  // container PID
            "%d\t"  // container PPID
            "%d\t"  // container PGID
            "%s\n", // command
            ns_ptr_hash, task_pid_nr(task), task_pid_nr_ns(task, ns),
            task_ppid_nr_ns(task, ns), task_pgrp_nr_ns(task, ns), task->comm);

    // If the process has a file descriptor table, call a helper function to
    // print the details of each file descriptor
    struct files_struct *files = task->files;
    if (files) {
        // Call a helper function to print out the details of each file
        // descriptor
        inspect_fds(files, sfile);
    }

    // Print extra newline to separate each process
    seq_printf(sfile, "\n");
}
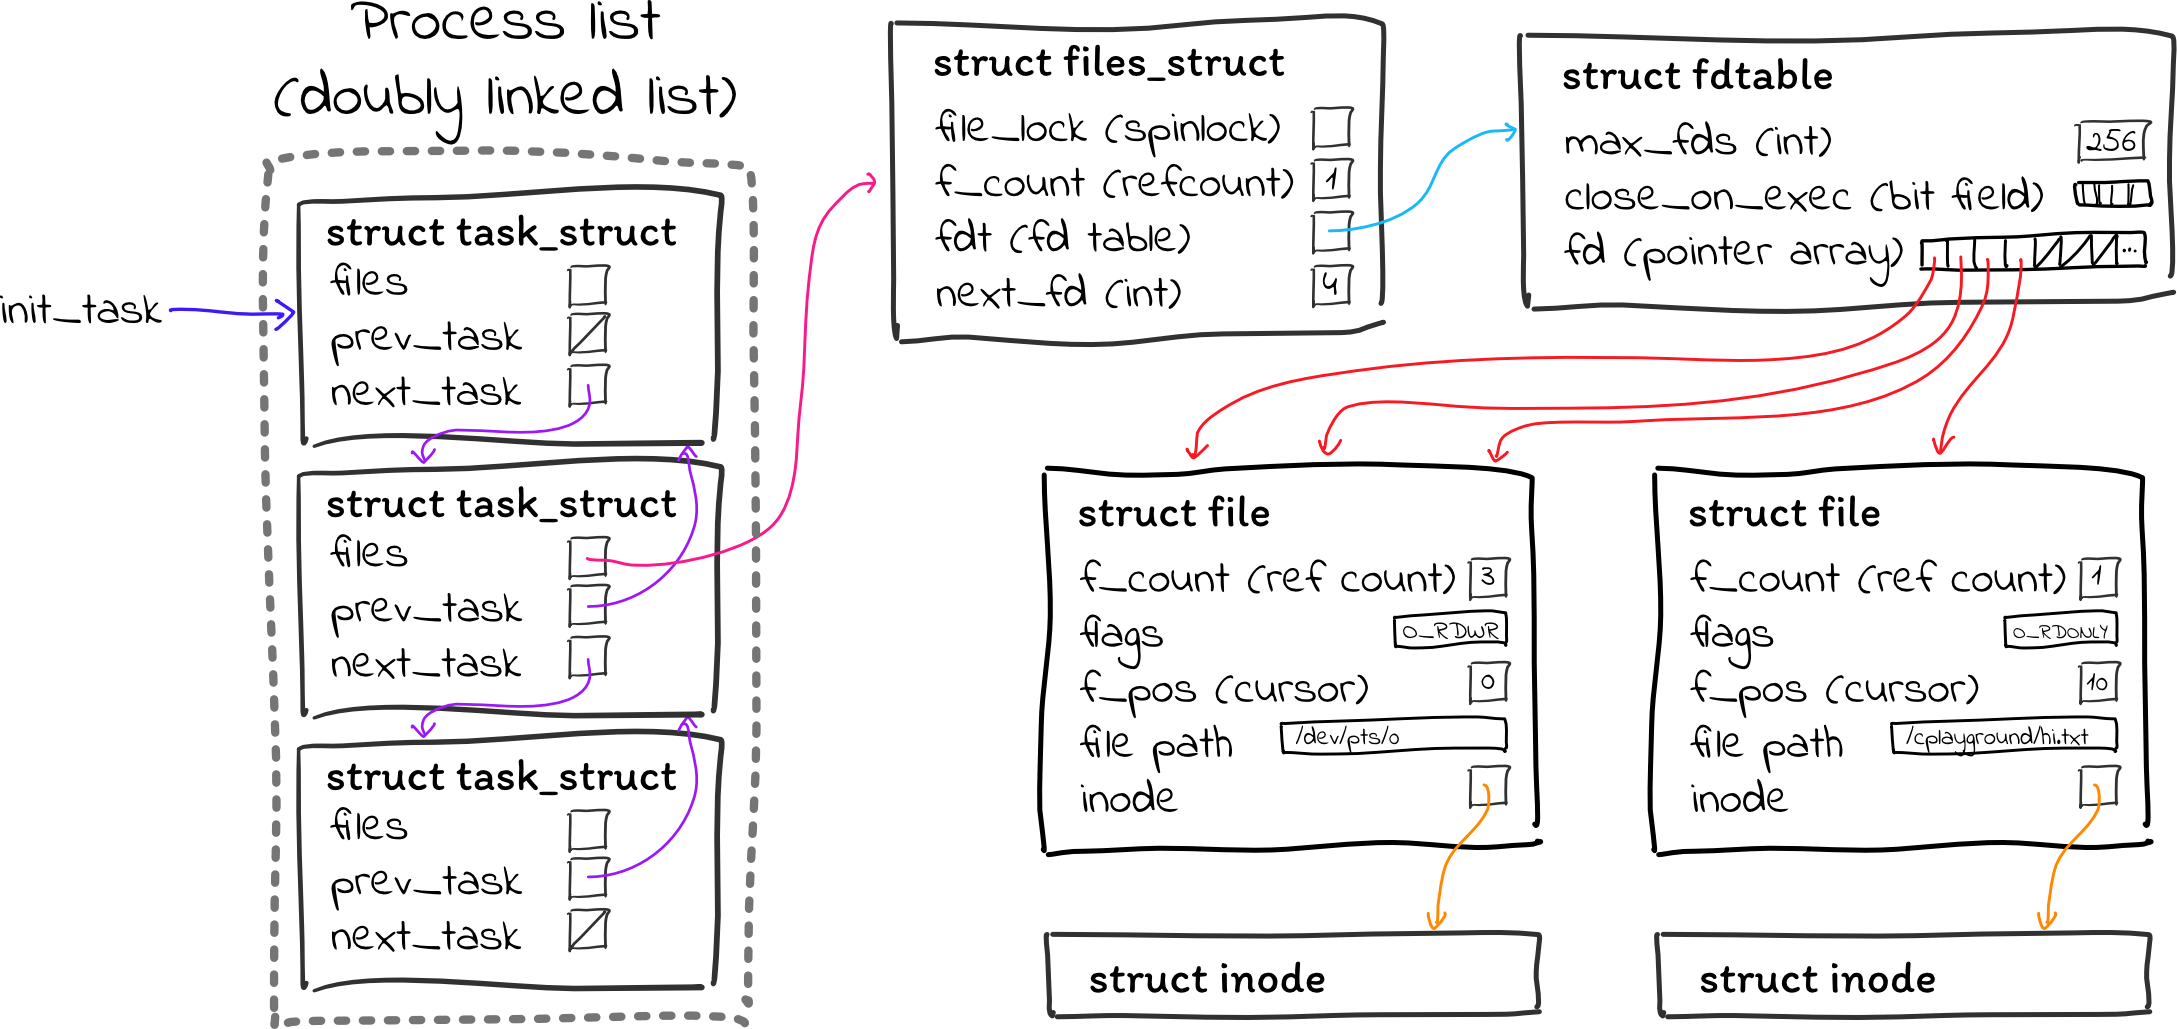
Next, we need to implement inspect_fds to print out information for each file
descriptor. There are a few relevant structs here:
task->files(of typestruct files_struct– again, why not juststruct files?) is a struct containing information about a process’s open files. It contains things like a pointer to the file descriptor table, a number for the next file descriptor that should be allocated (this is how file descriptors are allocated sequentially, even if you close fds in between), a spinlock for maintaining data consistency, and some other bookkeeping things.- That struct contains a pointer to a
struct
fdtable
, which implements the file descriptor table using an array ofstruct filepointers. - Each
struct
file
is an entry in the open file table. (The “open file table” as we teach it does not actually exist in one central location. It’s just a scattered series ofstruct fileallocations.) This struct contains a number of things, including:- Flags associated with the open file (e.g. is it a regular file, directory, or something else? Is it open for reading, writing, or both?)
- The cursor for the open file (how many bytes have been read/written?)
- The path of the open file on the filesystem
- The inode associated with this open file
Even once I got a sense of how to get data from the relevant structs, I had a
hard time putting everything together. I couldn’t find much documentation on
how to do things like this. The one example I did find is the kernel code that
implements /proc/{pid}/fd/{fdnum}. For anyone unfamiliar, you can read the
file /proc/100/fd/0 to get information about file descriptor 0 in process 100.
The code that implements this is in
fs/proc/fd.c.
Unfortunately, that code doesn’t have a single comment in it, and the
functions it calls are equally lacking in documentation, but I did my best and
ended up with this:
static void inspect_fds(struct files_struct *files, struct seq_file *sfile) {
    // TODO: is this necessary? Isn't there some mention of RCU?
    spin_lock(&files->file_lock);

    for (int fd = 0; fd < files_fdtable(files)->max_fds; fd++) {
        // TODO: what exactly does fcheck_files do?
        struct file *file = fcheck_files(files, fd);
        if (file) {
            struct fdtable *fdt = files_fdtable(files);
            // TODO: what is this doing? is fput releasing?
            get_file(file);

            // Call helper function to print a line of information about this
            // individual file descriptor
            inspect_fd(fdt, fd, file, sfile);

            fput(file);
        }
    }

    spin_unlock(&files->file_lock);
}
There are 33% as many wtf TODOs as there are lines of code! Looking back, I now understand this code a little better and can do a better job of explaining it:
- First, before touching anything, we acquire the spinlock inside of
task->files(thestruct files_struct). I wasn’t completely sure whether this was necessary, but theproc/fd.ccode does it, so I figured it was better to be safe than sorry. - Then, we iterate over each possible file descriptor number and use
fcheck_filesto get thestruct filethat each file descriptor points to. (If the file descriptor number doesn’t point to anything, we skip over it.) It wasn’t clear to me whatfcheck_filesdoes at the time, but I now understand that it’s basically doing a fancy thread-safe dereference of an entry in the file descriptor table. (This “fancy thread-safe dereference” has to do with a technique called RCU, which I describe later in this blog post.) files_fdtabledoes the same fancy thread-safe dereference to get the file descriptor table. We need this, even though we already have thestruct file, because we want to display whether the file descriptor hasO_CLOEXECset on it, and this is stored in the file descriptor table rather than in the open file table entry. (It’s possible to have two file descriptors pointing to the same open file table entry, where one file descriptor hasO_CLOEXECset and the other does not.)- It wasn’t clear to me what
get_filewas doing at the time, but I had some intuition which turned out to be correct:get_fileincreases the reference count of thestruct file(i.e. the open file table entry) so that it is not deallocated while we are using it. This is important, because if we don’t increment the reference count, then we could have a race condition where the process closes the file descriptor and the reference count of the open file table entry hits zero, so thestruct fileis deallocated while we’re looking at its contents. fputdecrements thestruct filereference count, freeing its resources if the reference count has hit zero.
That’s a whole lot going on, and we haven’t even printed out any file descriptor information yet! Fortunately, printing the file descriptor information isn’t too bad:
static void inspect_fd(struct fdtable *fdt, int fd, struct file *file,
struct seq_file *sfile) {
// TODO: locks?
char path_buf[512];
char* path_str = d_path(&file->f_path, path_buf, sizeof(path_buf));
char file_ptr_hash[64 + 1];
hash_pointer(file, file_ptr_hash);
// TODO: need to lock before getting f_pos?
seq_printf(sfile,
"%d\t" // fd
"%d\t" // close_on_exec
"%s\t" // open file id (file_ptr_hash)
"%lli\t" // file position/offset
"0%o\t" // flags
"%s\n", // vnode id (path_str)
fd, close_on_exec(fd, fdt), file_ptr_hash, (long long)file->f_pos,
file->f_flags, path_str);
}
Here’s a breakdown:
- I didn’t acquire any locks here, and I wasn’t sure if I needed to. I still am not sure whether I need to, but I’m slightly more confident that no locks are necessary and this code is fine.
- The
d_pathfunction serializes astruct pathto a string, so we can print the path of the file that this file descriptor points to. - Similar to how I generated namespace IDs, I hashed the pointer to the
struct fileso that we can easily identify when two file descriptors point to the same open file table entry. (Checking whether they point to the same file path is insufficient; you canopenthe same file twice, and that will produce independentstruct files with independent cursors, modes, etc.) - The
close_on_execfunction checks whether theclose_on_execbit is set for this file descriptor in the file descriptor table. - Everything else is relatively straightforward!
Here is a summary of all of the code that is involved:
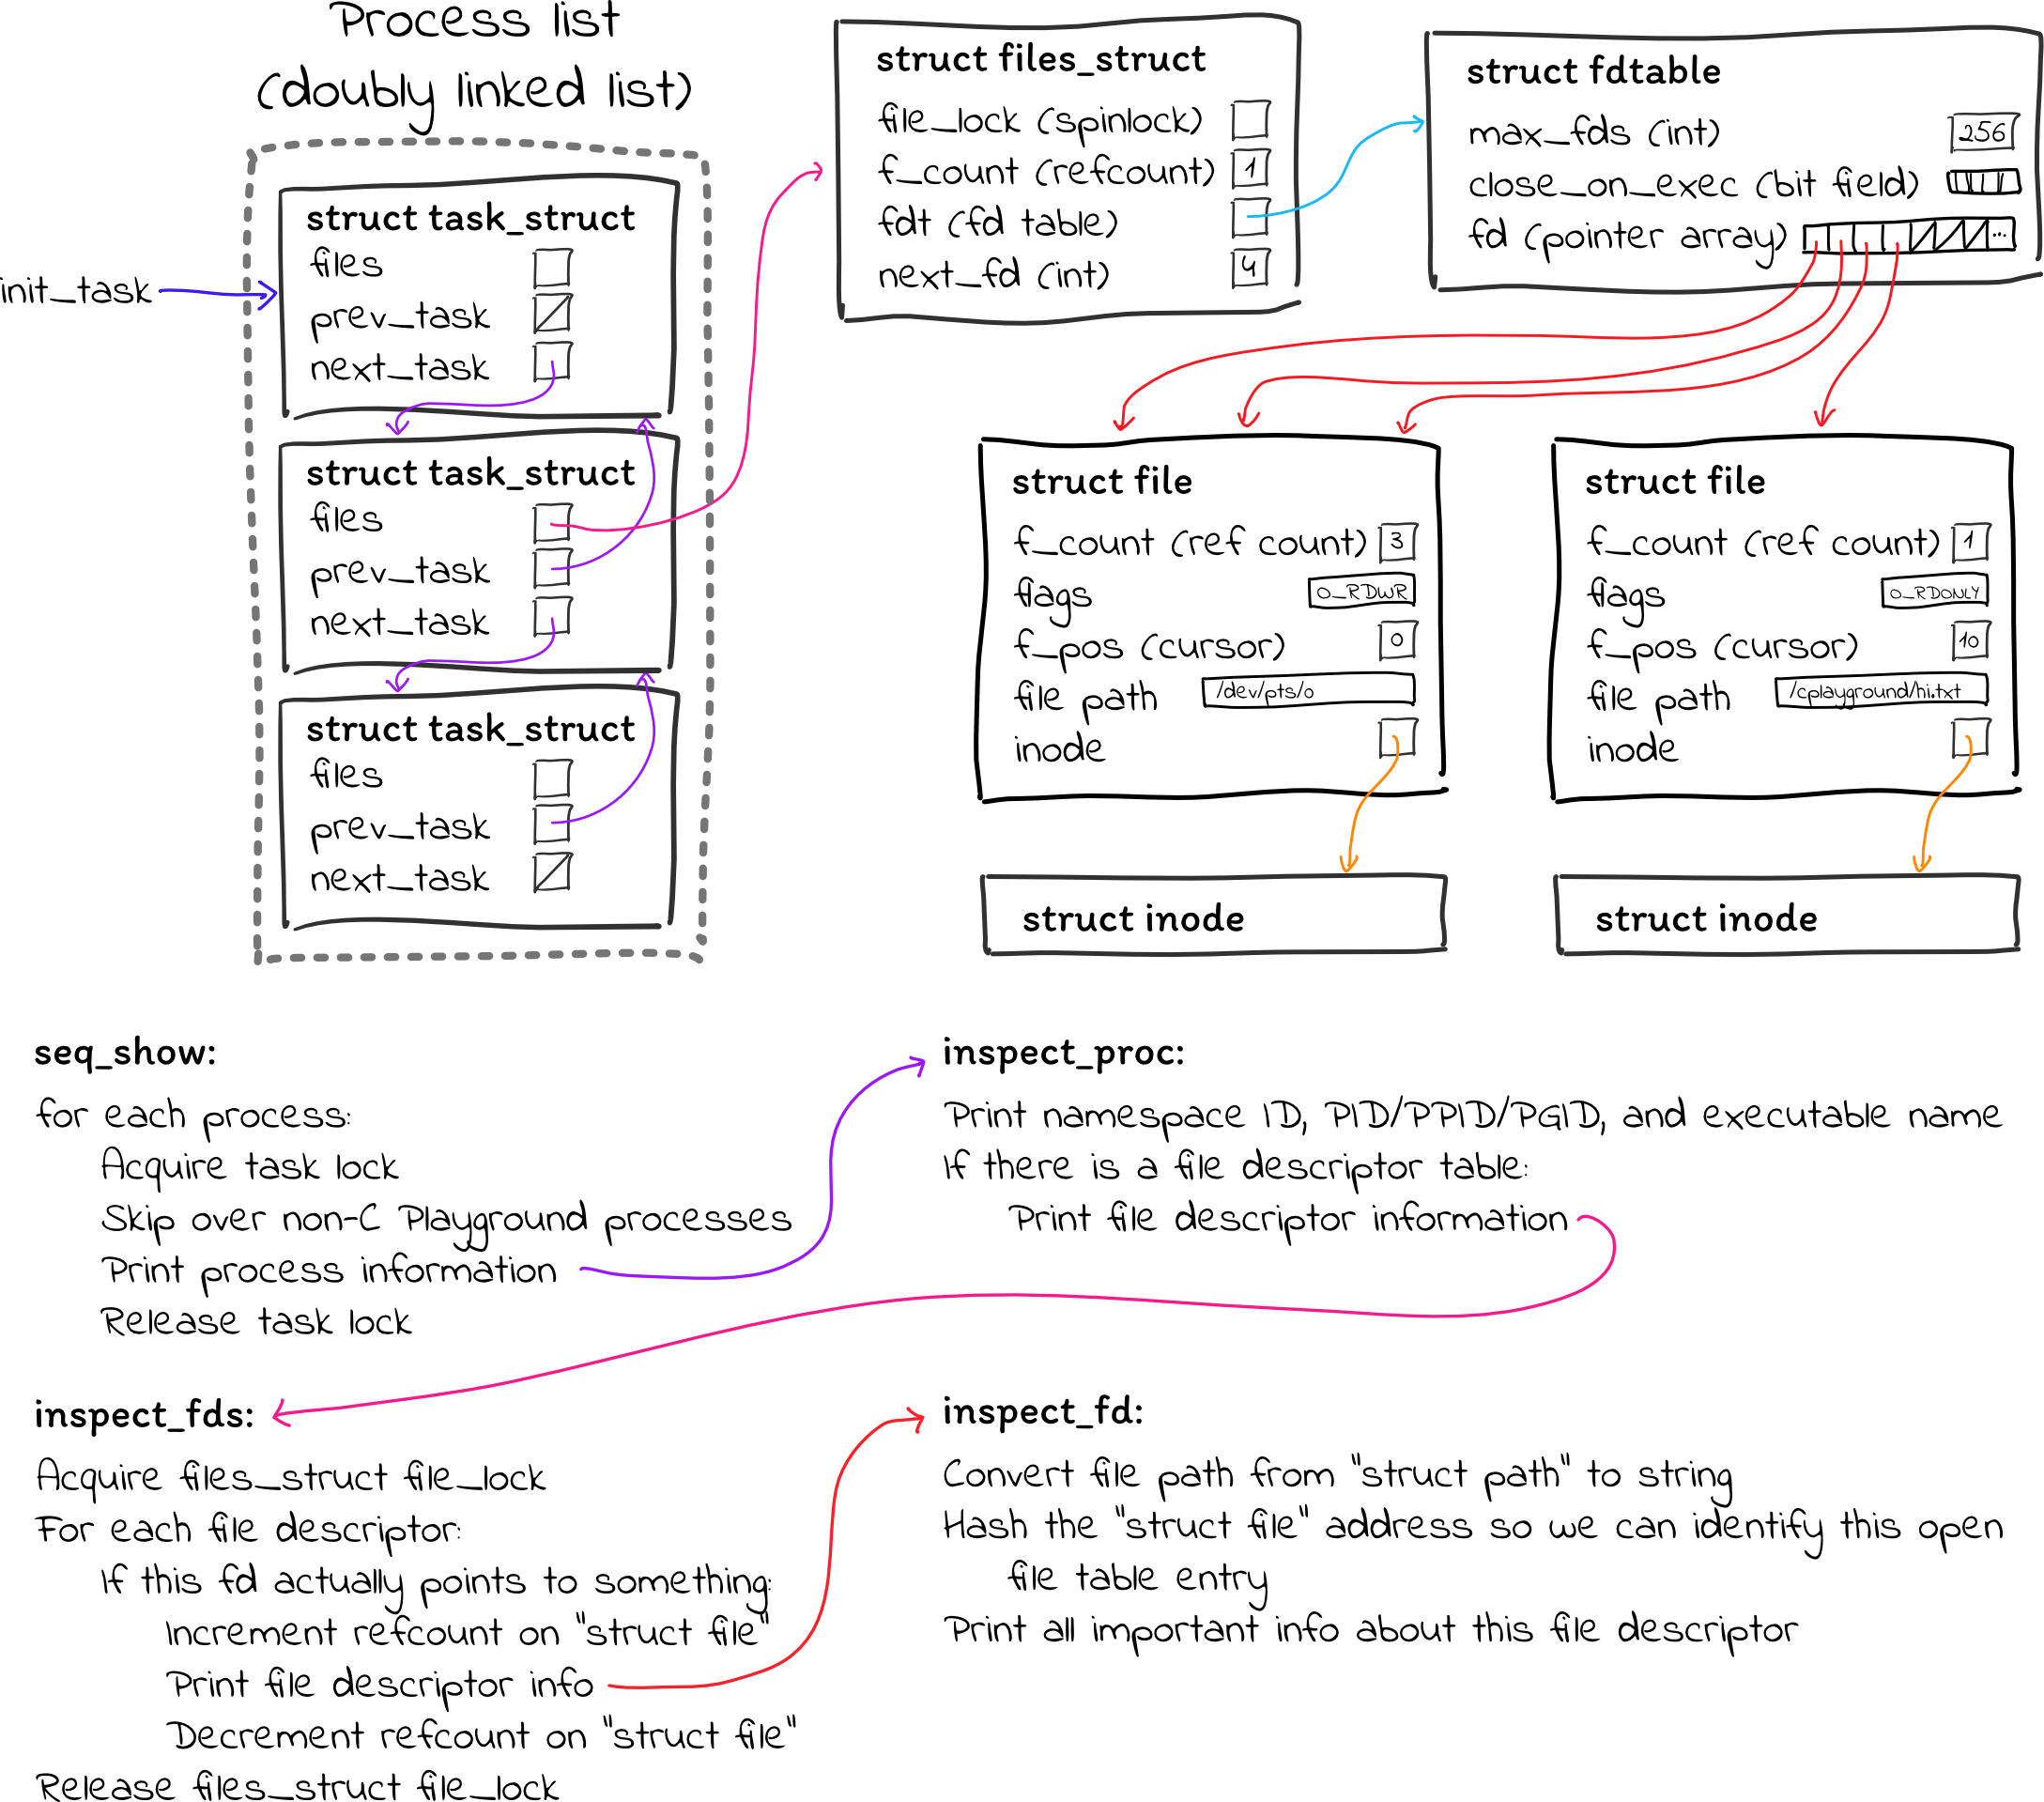
That’s about it! As you can see, the code is a little dense, but it’s not terrible. The overall control flow is quite simple, and even though I wasn’t 100% confident in everything, I thought the code was pretty reasonable. As you’ll see, it was very nearly correct, but was missing two critical pieces.
The debugging process
It took me about four or five days of nearly non-stop work to fix the problem. This is by far the most difficult thing I have ever debugged, and there were a lot of twists and turns in this adventure.
Finding a footing
The first thing I did to fix the problem was to figure out a way to reliably induce deadlock locally. I really needed a reliable test; since I don’t know what’s wrong, I won’t be able to tell when I’ve fixed the issue unless I can come up with a test case that fails reliably.
My code loops over processes and file descriptors, so a natural stress test was
to create as many processes and file descriptors as possible. (In hindsight, I
should have thought of trying this before I deployed to production.) A
forkbomb is a tiny program that repeatedly calls fork, creating processes
that grow exponentially in number: while (1) { fork(); } I modified this to
create a forkpipebomb:
while (1) {
    int fds[2];
    pipe(fds);
    fork();
}
Running this code under the C Playground debugger reliably induced deadlock within 30 seconds. Testing this way was pretty annoying; I would have to run the forkpipebomb, wait for it to deadlock, then force restart the VM, wait for it to boot, and start C Playground up again. It took about 5 minutes every time I wanted to make a change and see the results. Still, this was much better than deploying to production and waiting a day for it to randomly crash. I feel lucky that I was able to find a reliable test case so easily; many concurrency-related bugs are much harder to reproduce.
With this test setup, I was able to confirm my theory (from the introduction)
about the logs being lost due to buffering. I started dmesg in the VM, which
displays the kernel logs in real-time, in the hopes that I would be able to see
the logging messages, even if the kernel deadlocks before they are saved to
disk. Then, I ran the test program to induce deadlock, and just before
deadlocking, I saw a few log messages from my kernel module appear on the
screen. On reboot, those log messages were missing from /var/log/kern.log.
This confirmed my theory. The null bytes must mean the length of the log file
was extended, but the actual contents of the file didn’t make it to disk before
the kernel crashed. dmesg has its own buffering, so I still couldn’t see the
logs from just before the deadlock, but I could see enough to confirm that
the kernel module was indeed active at the time of the deadlock (and was
therefore definitely responsible).

Red herrings
I began hunting down the problem by adding more print statements to get more
logging information. In order to make sure there was enough time for my print
statements to show up in the dmesg output, I added msleep(5) after each
one. However, this just ended up giving me a huge amount of logging output,
with the code appearing to hang in different places each time. As I was sorting
through the logging output, I started to think, can I narrow this down? Is
this a problem iterating over the processes, or is it a problem going through
the file descriptors?
In an attempt to narrow things down to either the process code or the file
descriptor code, I replaced my forkpipebomb with just a “pipe bomb” (no
fork calls):
while (1) {
    int fds[2];
    pipe(fds);
}
Interestingly, this locked up immediately, even though I was only creating a single process:
Mar 25 18:38:09 ubuntu kernel: [ 3587.000754] cplayground: about to lock pid 2958
Mar 25 18:38:09 ubuntu kernel: [ 3587.000755] cplayground: container process!
Mar 25 18:38:09 ubuntu kernel: [ 3587.000756] cplayground: inspecting process 2958
Mar 25 18:38:09 ubuntu kernel: [ 3587.001043] cplayground: inspecting fds
This definitely sounds like a problem with going through the file descriptors!
What could cause a hang there? I don’t really lock besides acquiring the
spinlock in the struct files_struct. So, let’s see if that’s the problem:
@@ -116,10 +117,16 @@ static void inspect_fd(struct fdtable *fdt, int fd, struct file *file,
  * responsible for writing the contents of /proc/pid/fd/num).
  */
 static void inspect_fds(struct files_struct *files, struct seq_file *sfile) {
+    printk("cplayground: inspecting fds\n");
+    msleep(5);
     // TODO: is this necessary? Isn't there some mention of RCU?
     spin_lock(&files->file_lock);
+    printk("cplayground: acquired spinlock\n");
+    msleep(5);
Mar 25 18:56:24 ubuntu kernel: [  133.079549] cplayground: generating procfile
Mar 25 18:56:24 ubuntu kernel: [  133.079604] cplayground: container process!
Mar 25 18:56:24 ubuntu kernel: [  133.079605] cplayground: inspecting process 2516
Mar 25 18:56:24 ubuntu kernel: [  133.079623] cplayground: inspecting fds
Mar 25 18:56:24 ubuntu kernel: [  133.108014] cplayground: acquired spinlock
Mar 25 18:56:24 ubuntu kernel: [  133.123571] cplayground: done with process 2516
Mar 25 18:56:24 ubuntu kernel: [  133.123571] cplayground: unlocked pid 2516
Mar 25 18:56:24 ubuntu kernel: [  133.123572] cplayground: container process!
Mar 25 18:56:24 ubuntu kernel: [  133.123573] cplayground: inspecting process 2660
Mar 25 18:56:24 ubuntu kernel: [  133.123576] cplayground: inspecting fds
<deadlock>
Aha! I think this is pretty clear – it has to be the spinlock deadlocking. That is also consistent with the CPU being pinned at 100%; the kernel is endlessly spinning while trying to acquire this lock.

I wanted to sanity check my findings before I tried to figure out why the
spinlock was deadlocking, so I tried commenting out the spin_lock and
spin_unlock calls. This could cause data races, but it would at least allow
me to check whether the kernel continues to deadlock.
When I tried doing that, I was frustrated and discouraged to find that the code still deadlocked. It took a lot longer to deadlock, but it still ended up in the same state. That means there must be something else wrong, too.

The processes smell fishy
I wasn’t really sure what to make of this, so I started to read over the code again and think from scratch: What causes deadlock? Deadlock is often caused by circular lock dependencies: thread A has lock A but needs lock B, while thread B holds lock B but needs lock A. Maybe I’m locking in a bad order, which is causing bad interactions with other kernel threads?
Acting on this hypothesis, but without any sense of how my locking should look, I set out to minimize the amount of time I hold any one lock. Maybe if I don’t hold locks for very long, I can avoid clashing with other kernel threads seeking to acquire a lock I have.
However, when I did this, things got even worse. Instead of deadlocking, the kernel panicked with some error about a use-after-free:
[ 1586.949076] refcount_t: underflow; use-after-free.
[ 1586.949087] WARNING: CPU: 0 PID: 4468 at /build/linux-hwe-uR14Ux/linux-hwe-5.3.0/lib/refcount.c:288 refcount_dec_not_one+0x54/0x60
[ 1586.949088] Modules linked in: cplayground(OE) binfmt_misc xt_conntrack xt_MASQUERADE nfnetlink xfrm_user xfrm_algo iptable_nat nf_nat nf_conntrack nf_defrag_ipv6 nf_defrag_ipv4 libcrc32c xt_addrtype bpfilter intel_rapl_msr intel_rapl_common crct10dif_pclmul crc32_pclmul ghash_clmulni_intel aesni_intel aes_x86_64 crypto_simd cryptd vmw_balloon glue_helper intel_rapl_perf input_leds joydev serio_raw bnep snd_ens1371 snd_ac97_codec gameport ac97_bus snd_pcm snd_seq_midi snd_seq_midi_event snd_rawmidi uvcvideo videobuf2_vmalloc overlay videobuf2_memops snd_seq aufs videobuf2_v4l2 videobuf2_common btusb snd_seq_device btrtl videodev btbcm snd_timer btintel mc bluetooth snd ecdh_generic ecc soundcore mac_hid vmw_vsock_vmci_transport vsock vmw_vmci sch_fq_codel iptable_filter ip6table_filter ip6_tables br_netfilter bridge stp llc arp_tables vmwgfx ttm drm_kms_helper drm fb_sys_fops syscopyarea sysfillrect sysimgblt parport_pc ppdev lp parport ip_tables x_tables autofs4 hid_generic usbhid hid
[ 1586.949117]  psmouse mptspi mptscsih mptbase ahci libahci e1000 scsi_transport_spi pata_acpi i2c_piix4
[ 1586.949122] CPU: 0 PID: 4468 Comm: node Tainted: G           OE     5.3.0-42-generic #34~18.04.1-Ubuntu
[ 1586.949123] Hardware name: VMware, Inc. VMware Virtual Platform/440BX Desktop Reference Platform, BIOS 6.00 07/29/2019
[ 1586.949125] RIP: 0010:refcount_dec_not_one+0x54/0x60
[ 1586.949126] Code: f8 01 75 e2 31 c0 5d c3 b8 01 00 00 00 c3 80 3d b1 65 2f 01 00 75 dc 48 c7 c7 a0 07 b7 a5 c6 05 a1 65 2f 01 01 e8 1c 84 b8 ff <0f> 0b eb c5 31 c0 c3 0f 1f 44 00 00 55 48 89 e5 41 54 53 49 89 f4
[ 1586.949126] RSP: 0000:ffffbb9201d2bd00 EFLAGS: 00010286
[ 1586.949127] RAX: 0000000000000000 RBX: ffff9140b669e000 RCX: 0000000000000006
[ 1586.949128] RDX: 0000000000000007 RSI: 0000000000000082 RDI: ffff9140bbc17440
[ 1586.949128] RBP: ffffbb9201d2bd00 R08: 0000000000002feb R09: 0000000000000004
[ 1586.949128] R10: ffffbb9201d2bce0 R11: 0000000000000001 R12: ffffffffa5e5d920
[ 1586.949129] R13: ffff91405e586750 R14: ffff91405e585c00 R15: ffff91405e585c20
[ 1586.949130] FS:  00007f1d253f5700(0000) GS:ffff9140bbc00000(0000) knlGS:0000000000000000
[ 1586.949130] CS:  0010 DS: 0000 ES: 0000 CR0: 0000000080050033
[ 1586.949131] CR2: 0000564ebaced000 CR3: 000000004f1a8004 CR4: 00000000003606f0
[ 1586.949150] DR0: 0000000000000000 DR1: 0000000000000000 DR2: 0000000000000000
[ 1586.949150] DR3: 0000000000000000 DR6: 00000000fffe0ff0 DR7: 0000000000000400
[ 1586.949151] Call Trace:
[ 1586.949155]  cgroup_free+0x1c/0x50
[ 1586.949276]  __put_task_struct+0x42/0x180
[ 1586.949280]  ct_seq_show+0x125/0x3b2 [cplayground]
[ 1586.949283]  seq_read+0xda/0x420
[ 1586.949286]  proc_reg_read+0x3e/0x60
[ 1586.949287]  __vfs_read+0x1b/0x40
[ 1586.949288]  vfs_read+0x8e/0x130
[ 1586.949289]  ksys_read+0xa7/0xe0
[ 1586.949290]  __x64_sys_read+0x1a/0x20
[ 1586.949292]  do_syscall_64+0x5a/0x130
[ 1586.949295]  entry_SYSCALL_64_after_hwframe+0x44/0xa9
[ 1586.949296] RIP: 0033:0x7f1d2d959384
[ 1586.949298] Code: 84 00 00 00 00 00 41 54 55 49 89 d4 53 48 89 f5 89 fb 48 83 ec 10 e8 8b fc ff ff 4c 89 e2 41 89 c0 48 89 ee 89 df 31 c0 0f 05 <48> 3d 00 f0 ff ff 77 38 44 89 c7 48 89 44 24 08 e8 c7 fc ff ff 48
[ 1586.949298] RSP: 002b:00007f1d253f4d70 EFLAGS: 00000246 ORIG_RAX: 0000000000000000
[ 1586.949299] RAX: ffffffffffffffda RBX: 0000000000000016 RCX: 00007f1d2d959384
[ 1586.949300] RDX: 0000000000003cd0 RSI: 00000000035995a0 RDI: 0000000000000016
[ 1586.949300] RBP: 00000000035995a0 R08: 0000000000000000 R09: 0000000000000000
[ 1586.949300] R10: 0000000000000000 R11: 0000000000000246 R12: 0000000000003cd0
[ 1586.949301] R13: 0000000003249ac0 R14: 00007fff0118d5b0 R15: 0000000003249ac0
<many more lines of errors...>
Thankfully, this error at least has a stack trace, and it suggests some
funkiness coming from put_task_struct, which seems to imply there is a
problem with iterating over processes.

Taking a second look at my process-iterating code, I realized that even though I lock individual tasks, I never acquired any lock over the process list:
struct task_struct *task;
for_each_process(task) {
    task_lock(task);

    // Do stuff with the task...
    // ...

    task_unlock(task);
}
The process list is implemented as a doubly linked list, and
for_each_process
is a macro that simply follows the linked list pointers down the list. If the
process list is changed while we’re iterating over it, then following a next
pointer might lead us to an invalid process.

So, how does one safely iterate over the process list? Googling wasn’t too much
help at first. Many posts suggest using for_each_process without any mention
of thread safety. (I also did a Github search for for_each_process to try to
find an example of someone using it correctly, and I can say that there are a
lot of kernel modules that made the same mistakes as me…) The posts that
aren’t downright misleading suggest calling read_lock and read_unlock on
tasklist_lock. However, this seems to be an older synchronization mechanism
that has been gone from Linux for the last 10+ years. Eventually, I found some
posts that suggest calling rcu_read_lock() and rcu_read_unlock()
before/after iterating over the process list. I also found code for the /proc
filesystem that calls
for_each_process,
and it calls rcu_read_lock() before and rcu_read_unlock() after.
I tried adding the rcu functions, and… things got even worse. Now, the
kernel appeared to panic while handling completely unrelated processes, such as
gnome-shell and vmtoolsd:
[  120.167616] cplayground: finished generating procfile
[  120.388198] general protection fault: 0000 [#8] SMP PTI
[  120.388207] CPU: 0 PID: 1009 Comm: gnome-shell Tainted: G      D W  OE     5.3.0-42-generic #34~18.04.1-Ubuntu
[  120.388210] Hardware name: VMware, Inc. VMware Virtual Platform/440BX Desktop Reference Platform, BIOS 6.00 07/29/2019
[  120.388217] RIP: 0010:__kmalloc+0xa5/0x260
[  120.388221] Code: 65 49 8b 50 08 65 4c 03 05 f0 3c 37 48 4d 8b 38 4d 85 ff 0f 84 82 01 00 00 41 8b 59 20 49 8b 39 48 8d 4a 01 4c 89 f8 4c 01 fb <48> 33 1b 49 33 99 70 01 00 00 65 48 0f c7 0f 0f 94 c0 84 c0 74 bd
[  120.388223] RSP: 0018:ffffb88f818f3868 EFLAGS: 00010206
[  120.388226] RAX: 041ae859d18bce00 RBX: 041ae859d18bce00 RCX: 0000000000058205
[  120.388228] RDX: 0000000000058204 RSI: 0000000000000cc0 RDI: 000000000002f0a0
[  120.388230] RBP: ffffb88f818f3898 R08: ffff8f987bc2f0a0 R09: ffff8f987b407640
[  120.388231] R10: 0000000000000002 R11: 0000000000000000 R12: 0000000000000cc0
[  120.388233] R13: 0000000000000040 R14: ffff8f987b407640 R15: 041ae859d18bce00
[  120.388236] FS:  00007f49fcf31ac0(0000) GS:ffff8f987bc00000(0000) knlGS:0000000000000000
[  120.388238] CS:  0010 DS: 0000 ES: 0000 CR0: 0000000080050033
[  120.388240] CR2: 000000c00061b000 CR3: 00000000744d6003 CR4: 00000000003606f0
[  120.388251] DR0: 0000000000000000 DR1: 0000000000000000 DR2: 0000000000000000
[  120.388253] DR3: 0000000000000000 DR6: 00000000fffe0ff0 DR7: 0000000000000400
[  120.388254] Call Trace:
[  120.388261]  ? sg_kmalloc+0x19/0x30
[  120.388266]  sg_kmalloc+0x19/0x30
[  120.388270]  __sg_alloc_table+0x75/0x160
[  120.388274]  sg_alloc_table+0x23/0x50
[  120.388277]  ? sg_zero_buffer+0xc0/0xc0
[  120.388286]  ? ttm_mem_global_alloc_zone+0xf3/0x140 [ttm]
[  120.388290]  __sg_alloc_table_from_pages+0xc1/0x200
[  120.388305]  vmw_ttm_map_dma+0x141/0x300 [vmwgfx]
[  120.388318]  ? vmw_ttm_populate+0x37/0xa0 [vmwgfx]
[  120.388330]  vmw_ttm_bind+0x17/0xa0 [vmwgfx]
[  120.388336]  ttm_tt_bind+0x37/0x60 [ttm]
[  120.388343]  ttm_bo_handle_move_mem+0x4f2/0x5b0 [ttm]
[  120.388349]  ? ttm_bo_mem_space+0x17e/0x2f0 [ttm]
<truncated for length>
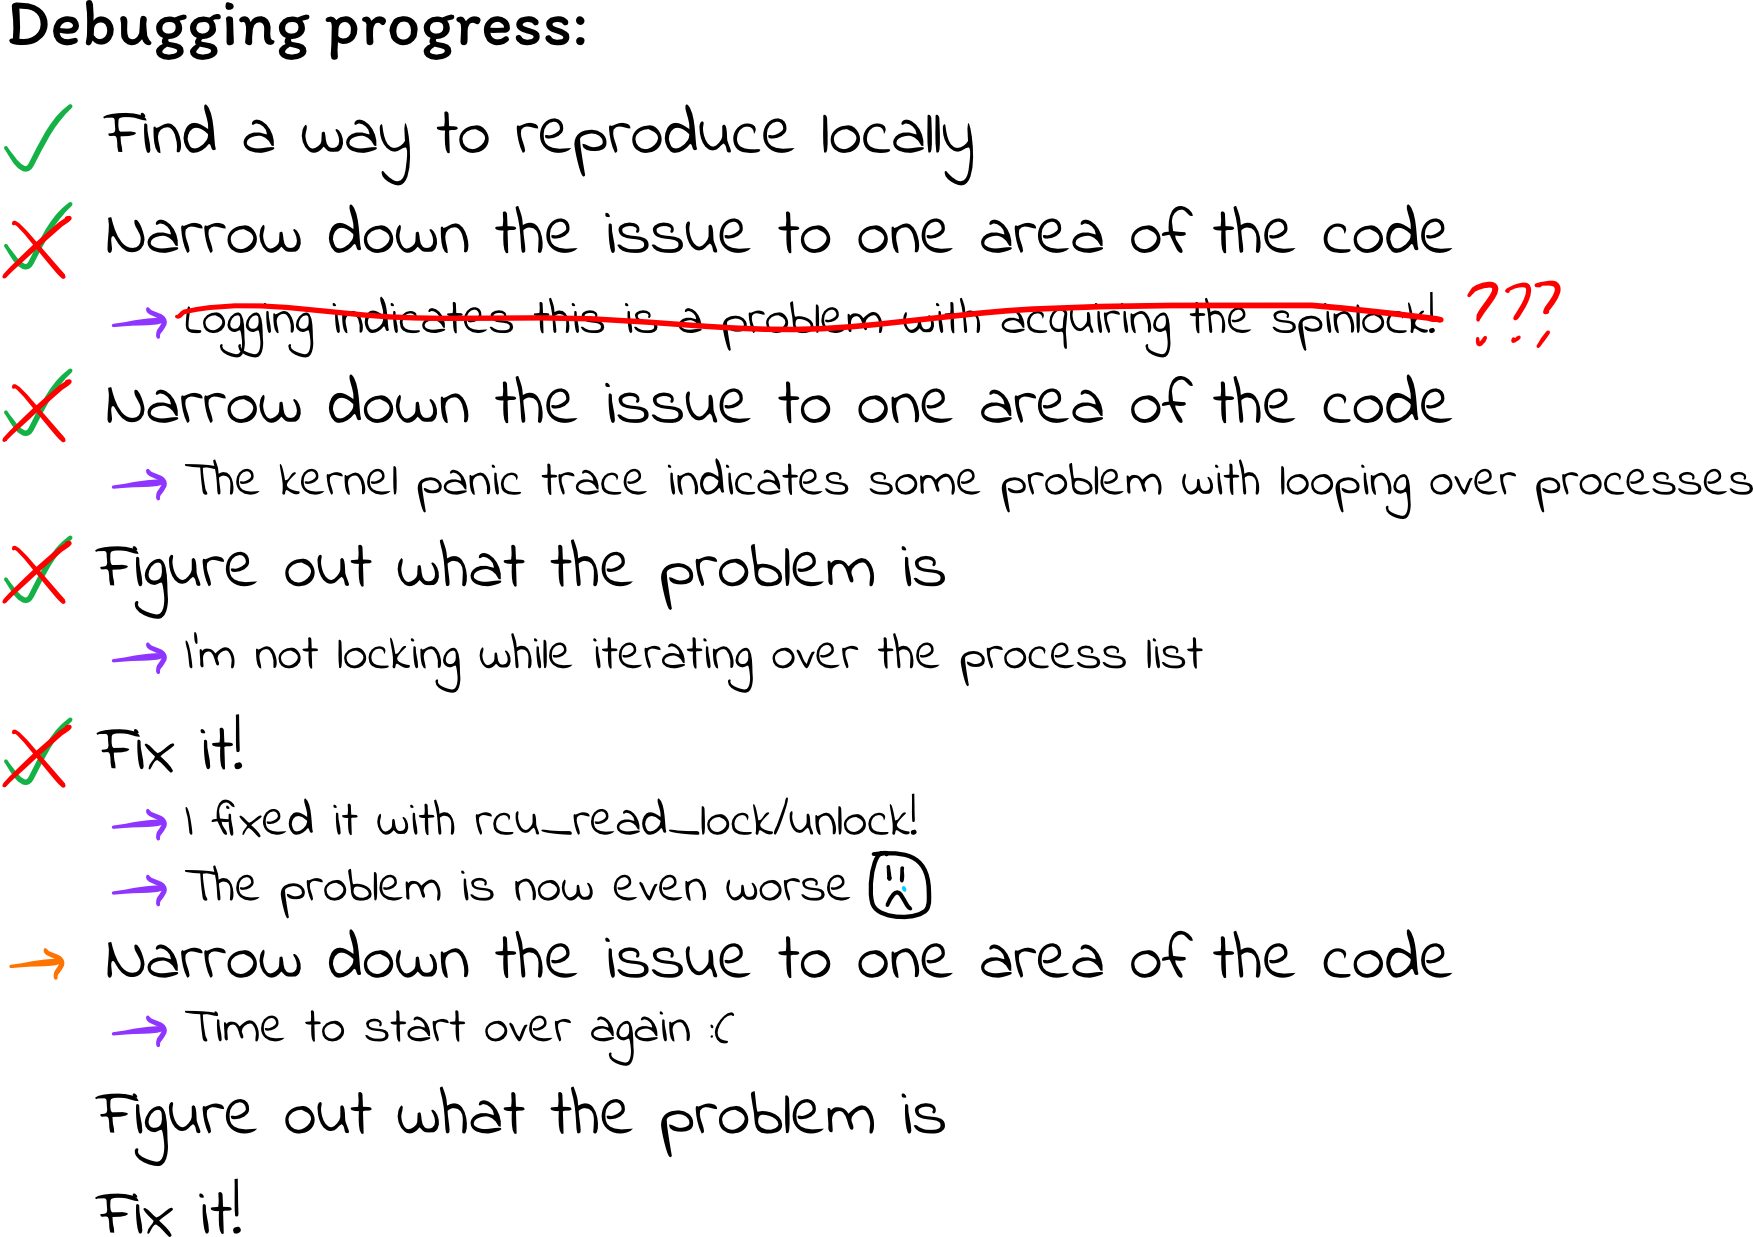
Desperation, and the start of progress
At this point, I really started to lose hope. First I had thought it was a
problem with iterating over the file descriptors, but then it seemed like a
problem iterating over processes, but then I thought I fixed that problem, yet
it seemed to make things even worse. I messaged a bunch of people asking if
they knew anything about kernel internals, but it seemed like I was on my own.
By this point, I had been working on this pretty much nonstop for three days. I
had spent so long reading articles online, trawling through kernel code, poring
over my own code, and pulling my hair out, yet I felt like I wasn’t any closer
to figuring out the problem and didn’t have anything to go off of. I was doing
basically the same thing as the kernel code that generates files in the /proc
filesystem; why were things failing so tragically?
Out of frustration, I decided to try the most primitive of debugging tactics: I commented everything out until the kernel module ran fine (because it wasn’t doing anything, lol), then gradually un-commented lines until things broke again. This was painful, given each iteration of this cycle took about five minutes, but it’s the strategy that ultimately led me to find my bugs.
When I commented out the code to iterate over file descriptors but left the code to iterate over processes, the kernel still panicked with a “general protection fault.” That gave me some confidence for where to focus my effort: there absolutely has to be a problem with my process-iterating code. There might be multiple problems, but there is at least one problem there.

struct task_struct *task;
rcu_read_lock();
for_each_process(task) {
    // Acquire the task lock before touching nsproxy
    task_lock(task);

    struct nsproxy *nsproxy = task->nsproxy;
    if (nsproxy == NULL) {  // indicates zombie process, according to docs
        task_unlock(task);
        continue;
    }
    struct pid_namespace *ns = nsproxy->pid_ns_for_children;
    if (ns == init_ns) {
        // This process is in the global PID namespace. Definitely not
        // a containzerized process.
        task_unlock(task);
        continue;
    }

    printk("cplayground: containerized process!\n");
    msleep(10);

    // Dobby is a free elf
    task_unlock(task);
}
rcu_read_unlock();
With my scope narrowed down to just a few lines of straightforward code, I was determined to get a better sense of exactly what my code was doing and why it might be failing.
RCU: Read, Copy, Update
I had heard of RCU from my operating systems class, but I forgot everything
about it, so I figured a good step would be to figure out exactly what
rcu_read_lock and rcu_read_unlock are doing.
This LWN article provides an excellent high-level overview of RCU. It’s a bit lengthy, and it depends on an understanding of memory barriers (see Preshing’s excellent blog posts on lock-free programming and memory barriers if you’re unfamiliar), but I recommend giving it a read if you want to learn more. I’ll provide a high-level summary of the high-level overview here.
When two threads want to share a piece of data (such as the process list), they must synchronize in order to avoid data races that occur when one thread modifies the data at the same time as at least one other thread is accessing it. This is most often done with a mutex or a spinlock. However, locks suffer from scalability problems: only one thread can hold the lock at any one time, and the more threads are involved, the greater the performance penalty from lock contention. Read-write locks help by allowing multiple threads to read the data at the same time (so long as no thread is modifying it), but there is still overhead from lock acquisition, and it’s impossible for a reader and writer to work simultaneously.
Read Copy Update (RCU) is a lock-free programming technique that allows threads to read data without any overhead. Readers don’t even need to increment any counters or anything like that; they can simply jump in and start accessing data. In addition, a single writer thread can modify the data at the same time as other threads are reading.
That sounds like magic. How is that possible? If the reader is accessing some data structure, and the writer modifies a portion of the data structure while the reader is using it, won’t that corrupt the data from the reader’s point of view?
The core of this technique depends on the writer making a separate, modified copy of the data structure and then atomically setting a global pointer to point to the new version of the data structure. At a high level, the technique goes like this:
- Threads access the data structure via some pointer to a struct. Reader threads simply dereference the pointer to get the data structure.

- When a writer thread wants to change the data structure, it copies the data structure to a new location in memory and makes any modifications it desires.

- It then atomically updates the pointer to point to its new copy. Note that any existing readers of the data structure will have already dereferenced the pointer, so they will continue using the old copy of the struct with no awareness that anything has changed. (Notably, there are no data races.)

- The writer then waits until all readers have finished using the old copies of the data structure. (This part is actually a bit tricky, and I’ll discuss it next.)

- Finally, once the writer knows no readers are using the old copy of the struct, it frees it.

Conceptually, this is fairly simple, but actually implementing it is much harder. In particular, how can a writer keep track of when all the readers have finished reading the old data structure? As mentioned, we want to make this as fast as possible for readers to use the information, and as such, we would like to avoid making them update any bookkeeping information (such as a reference counter).
The kernel uses a clever hack to deal with this. The rcu_read_lock function
disables preemption, meaning the kernel code that calls it cannot be kicked
off the processor in the middle of doing something due to an expired time
slice. (rcu_read_unlock later re-enables preemption.) Furthermore, by
convention, rcu_read_lock and rcu_read_unlock delineate a critical region
in which the kernel thread should not block or sleep. (This makes sense: we
want to minimize the amount of time that threads are using these shared data
structures. If they block or sleep, the writer threads may need to wait an
unbounded amount of time before they can free old copies of the data
structures, and it may make us more prone to deadlock due to circular
dependencies.) Consequently, a kernel thread which is reading an RCU data
structure will stay on the processor until it is done reading it. A writer
thread can exploit this fact by simply waiting until all threads currently on
the CPU yield to the scheduler. Once all threads give up the CPU, we know that
any thread that was using the old copy of the data structure will have finished
using it, and we can free it. Any threads that started using the data structure
since then will be using the new copy that the writer thread installed.
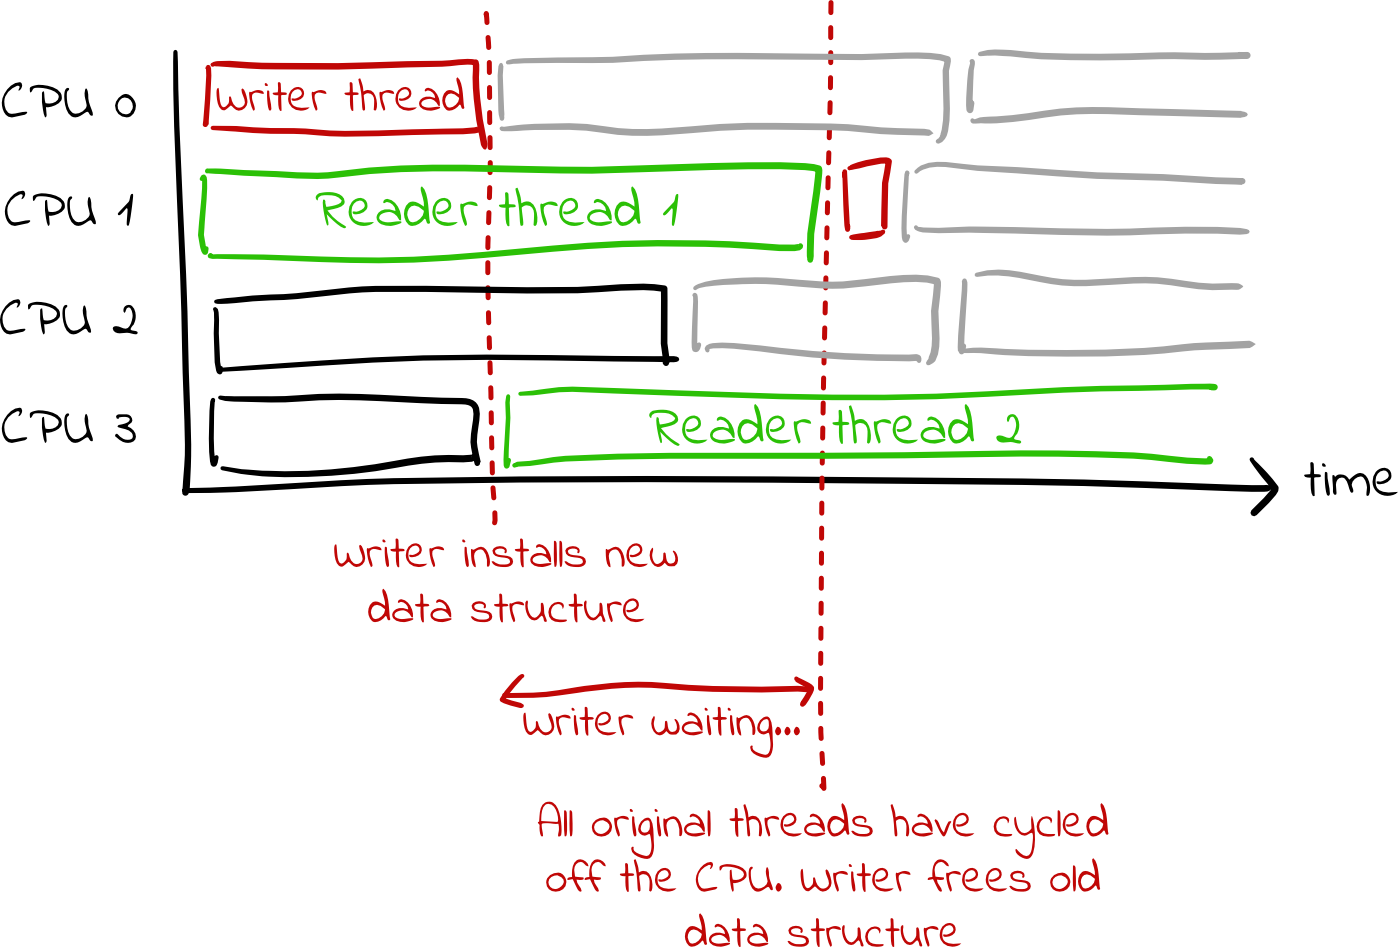
Side note: This diagram glosses over some less-important details. For the curious, the writer thread actually schedules itself on each core, as that is how it determines when all original threads have given up the CPU. That extra scheduling is not drawn here.
Note that this is not the optimal strategy for deciding when to free memory. Say that we are running on a quad-core machine, with the writer thread running on core 0 and three unrelated threads (which are not accessing the RCU data structure at all) are on cores 1-3. If the writer thread updates the RCU data structure, it will wait for the threads on cores 1-3 to yield the CPU just to make sure that they are no longer using the old copy of the data structure, even though they were never touching the data structure in the first place. In this scenario, the ideal behavior for the writer thread would be to immediately free the old copy without waiting at all. However, as mentioned, the kernel employs this strategy in order to minimize the overhead for reader threads. (Using this strategy, reader threads need to do almost nothing when accessing a list.)
Side note: It used to be the case that the Linux kernel was non-preemptible by
default, meaning that kernel code would never be forced off the processor in
the middle of doing something due to an elapsed time slice. My understanding is
that RCU came first, then later, the kernel code was made to be preemptible. As
such, from my understanding, having rcu_read_lock disable preemption wasn’t
part of the original RCU design, and was only done later to keep RCU working in
a preemptible kernel. The kernel
documentation
(section 5B) shows rcu_read_lock/unlock without disabling preemption in the
context of an older kernel.
With this explanation in place, it becomes more clear why my code was failing so spectacularly. The above strategy depends on the assumption that reader threads will not yield the CPU until they are finished working with the RCU data structure. That means that they cannot sleep or block. Here’s my code once again:
struct task_struct *task;
rcu_read_lock();
for_each_process(task) {
    task_lock(task);

    // Some omitted code...

    printk("cplayground: containerized process!\n");
    msleep(10);

    task_unlock(task);
}
rcu_read_unlock();
The task_lock function acquires a spinlock, so that doesn’t block, and won’t
cause problems. However, printk can block (while allocating memory), and
msleep obviously sleeps.

Finally, things started to make sense. All my debugging attempts appeared to
make things worse because they were making things worse! I was getting a copy
to the process list, then iterating over the processes in it. However, for each
containerized process, I was yielding the CPU (during the printk or
msleep), indicating to any threads modifying the process list that it is safe
to free the old copy (i.e. the copy that I am using). Then, after the printk
or msleep, I got back on the processor and continued using the old process
list that had already been freed. The more logging I added, the more pronounced
this issue became, because I yielded the processor more frequently and for
longer durations of time.
I also finally understood why the original symptoms might be happening. I
started this investigation because the kernel was deadlocking, and my early
debugging seemed to suggest that it was hanging while attempting to acquire the
spinlock in the task->files files_struct. I had interpreted that to mean
there was some problem printing file descriptor information, but actually, this
was happening because I was using task after it had been freed. Presumably,
the memory that task->files previously pointed to was now being used for
something else, and task->files->file_lock is now arbitrary data. Attempting
to acquire that lock causes deadlock, because it isn’t a lock anymore! If we
interpret the new bytes in that region of memory to be a spinlock, and the
spinlock appears locked, we will spin forever waiting for it to be unlocked,
because it isn’t a spinlock and will never be unlocked.
Fix #1: Don’t block in critical sections
Even though I finally had a sense of what was wrong, I still wasn’t sure how to
fix it. Somehow, I needed to avoid blocking in between rcu_read_lock and
rcu_read_unlock. However, pretty much all of my code lies between those two
bounds. I believe seq_printf allocates memory (and therefore can block), and
I allocate memory each time I call hash_pointer to generate a namespace ID or
open file ID. There also might be other functions that can block that I’m not
aware of.
After struggling for a while, I came up with a very janky but good-enough solution: First, iterate over the process list, identify containerized processes, increment their reference count (to prevent them from being deallocated), and add them to an array of containerized processes. I can do all of this without blocking. Then, I can go back over the array of containerized processes that I populated, and for each process, I can print the process/file descriptor information as usual without worrying about blocking.
const unsigned int max_container_tasks = 4096;  // 16 pids/container * 256 containers
struct task_struct **container_tasks = kmalloc(
    max_container_tasks * sizeof(struct task_struct *), GFP_KERNEL);
if (container_tasks == NULL) {
    printk("cplayground: ERROR: failed to alloc memory for container task pointers\n");
    return -ENOMEM;
}
int container_tasks_len = 0;

struct task_struct *task;
rcu_read_lock();    // begin critical section, do not sleep!
for_each_process(task) {
    task_lock(task);

    // Skip over containerized processes, same as before
    // ...(omitted)...

    // Increment reference count on the process, so that it is not
    // deallocated before we get a chance to use it
    get_task_struct(task);

    task_unlock(task);

    // Add process to array of containerized processes
    container_tasks[container_tasks_len++] = task;
    if (container_tasks_len == max_container_tasks) {
        printk("cplayground: ERROR: container_tasks list hit capacity! We "
            "may be missing processes from the procfile output.\n");
        break;
    }
}
rcu_read_unlock();  // end rcu critical section

// Now, we can iterate over container_tasks and print out the information
// for each process without needing to worry about blocking!
for (unsigned int i = 0; i < container_tasks_len; i++) {
    struct task_struct *task = container_tasks[i];
    // ...
}
As you can see, this has the limitation that there is an upper bound on how many processes we can show data for. However, I am fine with that limitation for now. We are going to face other problems in scaling before this becomes a real issue.

The emotional rollercoaster continues
As soon as I was done celebrating my fix, the kernel deadlocked again. My code ran for much longer than before without deadlocking, but clearly, something was still wrong.
As I was going through my code and the Linux kernel code again for the 200th
time, I remembered something I had seen in the
fs/proc/fd.c
code but had omitted in my own code. Recall that a struct files_struct,
accessible as task->files, contains a pointer to the file descriptor table as
well as some metadata about the file descriptor table. My code was retrieving
that struct by directly accessing task->files. However, the fs/proc/fd.c code
does it by calling a get_files_struct function. It later calls a
put_files_struct function. Looking into these (undocumented) functions, it
appears that get_files_struct increments a reference count on the struct
files_struct; put_files_struct decrements the refcount and frees the struct
if the refcount has hit zero.
My code increments the refcount on the task, and I had assumed that this
would prevent the struct files_struct from being freed. (If the task
appears to still be in use, I would think that task->files would be left
alone.) However, this assumption turns out to be wrong. It seems that when a
process exits, the struct task_struct is left alone if the refcount has been
incremented, but all the structs it points to are freed unless their specific
reference counts have been incremented.
I was able to test this theory by calling atomic_inc(&files->count) to
increment the reference counter, then calling
atomic_dec_and_test(&files->count) to decrement it after printing all the
relevant file descriptor information. In some cases, atomic_dec_and_test
returned zero, indicating that the reference count of the struct files_struct
had already been decremented and the struct would have been destroyed if not
for my atomic_inc call.

So, I need to increment the counter to ensure the struct doesn’t get freed, and
I need to decrement it when I’m finished. No problem – that’s what
get_files_struct and put_files_struct do. Except it turns out I can’t
actually call those functions. For whatever reason, those symbols are not
exported from the kernel source. You can call them if you’re inside the kernel
source code, but if you’re implementing a loadable kernel module (as I am),
they are off limits. I’m not sure if someone just neglected to export those
functions and no one ever noticed because no one has tried to do something as
janky as I’m doing, or if there is some reason they’re not exported (there
doesn’t seem to be one I can think of), but that’s the way it is.
I tried implementing the functions myself. They’re pretty short; you can find
their definition in
fs/file.c.
get_files_struct is easy to reimplement, as it simply calls atomic_inc to
increase the reference count. put_files_struct calls atomic_dec_and_test to
decrement the counter, but then it calls __free_fdtable to free the file
descriptor if the reference count has hit zero, and, reasonably, that function
is also not exported and therefore cannot be called by my kernel module.
Fix #2: Rebuilding the kernel
This was the most annoying problem I dealt with, because it demanded a lot of
work for absolutely no reason. If get_files_struct and put_files_struct
were exported symbols, there would be no problem, but they are not, so I have
no way to call them or mimic their functionality.
I spent a long time searching on GitHub to see how other people deal with this
issue, and from what I found, they… don’t. The small amount of code I could
find naively calls atomic_inc and atomic_dec_and_test. If the reference
count hits zero, they do nothing to free the file descriptor table, therefore
leaking memory.
After a lot of searching, the only solution I could come up with was to modify and rebuild the kernel myself, exporting the functions this time. It’s a shitty solution for sure, since it means I now must install a custom kernel on any machine I want to run C Playground on, and it also means I’m now responsible for keeping the kernel up to date. However, I can’t think of any other options. Android and OpenWRT appear to have done the same thing. I’m not sure why this isn’t a thing in mainline Linux. I meant to ask in the Linux forums, but I was too intimidated and never got around to it.
The patch I
applied
is literally two lines long. It took me a long time to figure out how to build
the kernel, and it took almost five hours to compile… But once that was
finished, I as able to call get_files_struct and put_files_struct to
properly guard that memory!
With that, my forkpipebomb test finally ran consistently with no problems.

If you’re curious, you can find the final code here. There are probably a million other things wrong with it, but at least it’s better than the bad advice that comes up in Google search results that I learned from.
Conclusion
It has been three months and the code hasn’t crashed since, so I think I fixed everything, but to be honest, I’m still not sure! :) I guess that’s how things work in kernel land. I know there are thread sanitizers and race detectors for user space code, but I don’t know of equivalent tools for kernel code. It seems that much of the development process depends on knowledgeable developers and a good code review process. Without any past experience and without access to people who know what they’re talking about, this was a pretty challenging endeavor for me.
Lessons learned:
- Test thoroughly before releasing code! Of course, it’s impossible to come up with test cases for every edge case scenario, but I could have done much better here. My code deals with processes and file descriptors, so a natural stress test would have been to generate a ton of processes and file descriptors.
- Sometimes, the simplest debugging techniques are the best ones. I spent so long trying to narrow down the problem before resorting to simply commenting out code.
- Don’t block inside of critical sections. Critical sections in the kernel are different from critical sections in user-space code. Blocking while holding a lock can more easily cause deadlock and will kill performance when accessing core data structures.
- The kernel uses reference counting extensively to manage memory. Incrementing a reference count is sort of like acquiring a lock in the sense that you are reserving a handle to the memory and ensuring that no one else frees it while you’re using it. Without incrementing the reference count, you don’t really have any guarantees that the memory you’re using won’t be freed.
- The kernel is fairly aggressive about decrementing reference counts and
freeing memory. Even if you have a reference-counted handle to
task, that will not automatically give you handles to reference-counted data structures pointed to bytask. (In our case, we had a handle totask, but also needed to get a reference-counted handle totask->files.)
Also:
- I am not a kernel programmer, and I could not pretend to be one even if I tried. Linux developers, I am not sure how you do your thing, but I have mad respect for you.
- There is a lot of bad code on the internet. Just go to sleep, because everything is broken anyways :) [Programming sucks]
Many thanks to Mark Sabini, Rakesh Chatrath, and Vinesh Kannan for providing feedback on early versions of this post.
I'm Ryan, and I would love to hear from you. Send me an email or leave a comment below!

Interested in reading more articles like this one? Join my mailing list and I'll email you when I publish a new post! I typically post less than once a month.