Generating Diagrams for Teaching Multiprocessing
This project was developed by Isaiah Bush and myself. Many thanks to Isaiah for his excellent work in building out the frontend portion of this project.
Learning multiprocessing is hard. It’s like landing in a foreign country where you speak the language, but the social conventions are wildly unfamiliar. All the words seem to make sense, yet despite your best intentions, you manage to offend every person you meet, and everyone refuses to cooperate with you. Worse, no one will explain why they are upset; at best, they mutter cryptic phrases like “EPERM” and “EINVAL”, and at worst, they glare at you and say nothing. You continue your march of faux pas until the kernel eventually banishes you with a segfault.
We wanted to make multiprocessing easier to learn through use of diagrams, providing transparency into what is happening in the kernel instead of making you fumble until you figure it out.
Teaching multiprocessing
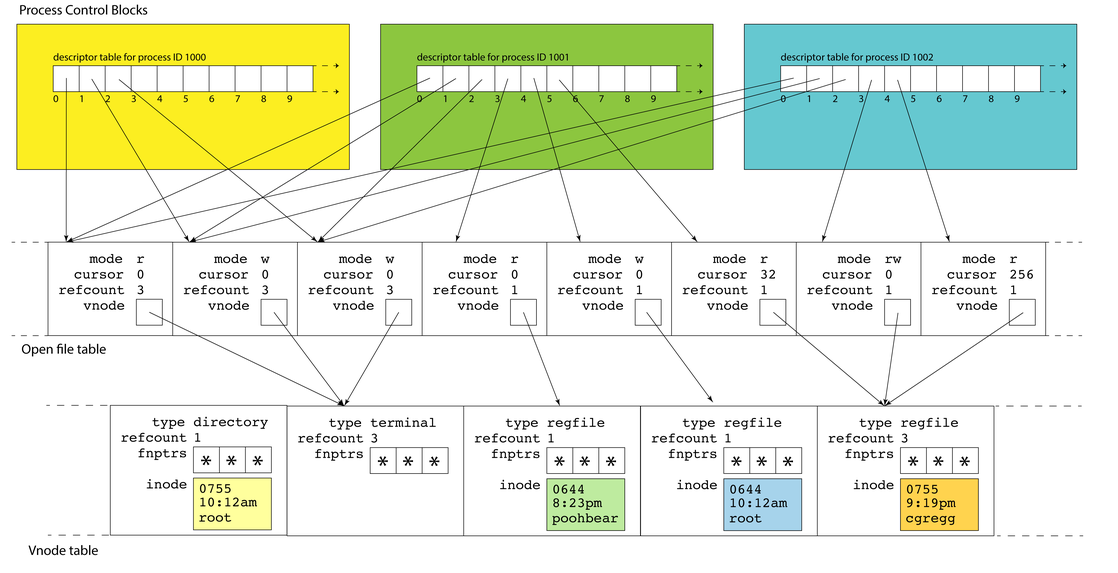
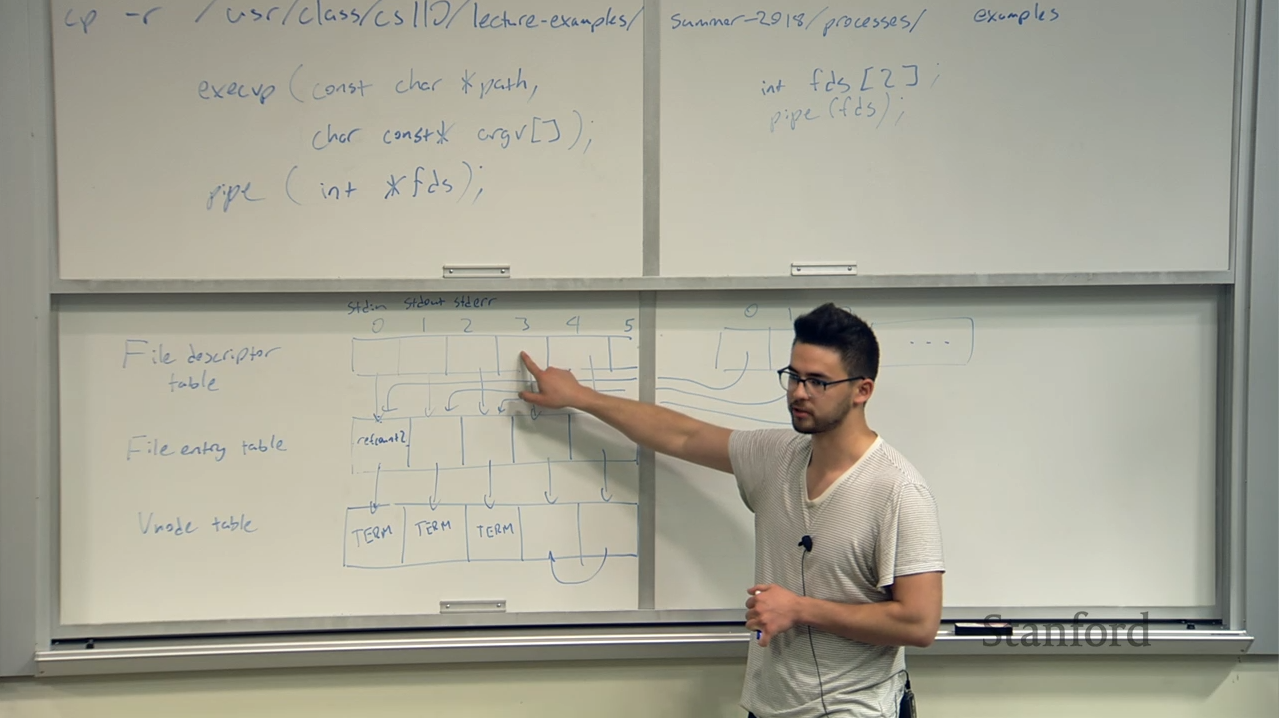
In Stanford’s CS 110 (Principles of Computer Systems), we teach multiprocessing by walking students through each system call that they are likely to use for common scenarios. For each system call, we explain the effect that it has on the kernel’s internal data structures. When explaining files and multiprocess communication, we focus on the vnode table (which stores information about files on the system), the open file table (which stores information about file sessions, such as how many bytes have been read from a particular open file), and the file descriptor tables (each process has one; it is an array of pointers to entries in the open file table, indicating which sessions a process has open). Without this understanding, it is almost impossible to correctly string together various combinations of system calls in order to achieve a desired outcome.
This involves a lot of diagramming. When we explain pipe, we show how it
creates two new “files” that are linked such that data written to one of them
can be read from the other. When we explain dup2, we show how the destination
fd (file descriptor) is closed (i.e. its arrow is erased), and then a new arrow
is drawn from the destination fd to the open file pointed to by the source fd.
These diagrams are crucial to capturing understanding of how these system calls
work; if you can draw a diagram of the kernel data structures at an arbitrary
point in a program, then you much better understand what’s going on with that
code. To demonstrate this with a concrete example, here is a toy example
program with an issue that a student is likely to encounter in some form. It is
supposed to feed a series of words to a sort subprocess (which will then
print the words to the terminal in sorted order), then wait for sort to exit.
However, if this broken version is run, it immediately hangs, printing no
output to the screen. Can you spot the error?
1
2
3
4
5
6
7
8
9
10
11
12
13
14
15
16
17
18
19
20
21
22
23
24
25
26
27
28
29
30
31
32
33
int main() {
    // Create pipe to ferry data from the parent process to
    // the child `sort` process
    int fds[2];
    pipe(fds);

    // Fork off child process, which rewires stdin to get
    // input from the pipe, then launches `sort`
    pid_t pid = fork();
    if (pid == 0) {
        dup2(fds[0], STDIN_FILENO);
        close(fds[0]);
        const char *sort_argv[] = {"sort", NULL};
        execvp(sort_argv[0], (char**)sort_argv);
    }

    // In the parent process, write the words to the pipe
    close(fds[0]);
    const vector<string> words = {"cat", "dog", "banana"};
    for (const string &word : words) {
        dprintf(fds[1], "%s\n", word.c_str());
    }
    // Close the write end of the pipe to indicate to the child
    // process that we are done sending words
    close(fds[1]);

    // Now that all words have been written and the pipe has
    // been closed to signal we are done, wait for the child
    // to exit
    waitpid(pid, NULL, 0);

    return 0;
}
The error may be difficult to immediately spot in the code, even for someone fairly familiar with multiprocess communication, but diagrams make it much easier to find.
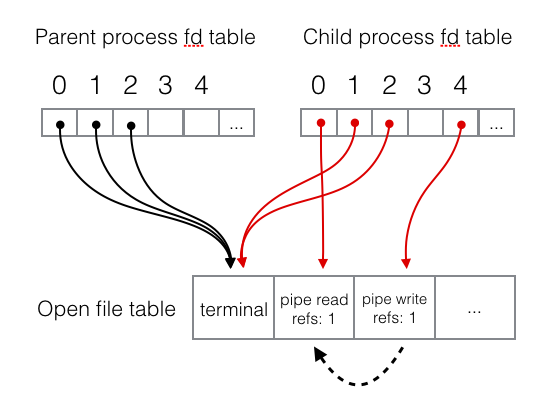
This program creates a pipe (i.e. creates two new files), then forks a child
process, and, in the child process, rewires stdin to get input from the read
end of the pipe. At the end of the child process’s code (line 14), the file
descriptor tables and open file table look like this:
Then, the parent writes a series of words to the pipe, and closes the write end
of the pipe to indicate to the child process that it is finished sending data.
At this point, the sort child process should print the sorted words to the
screen and exit, but that’s not what happens. No output is printed to the
screen, and the program hangs with the parent process waiting at the waitpid
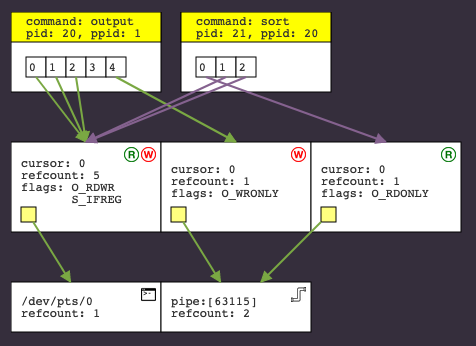
call. If you were to trace through each line of the program and draw a diagram
showing the state of the kernel data structures at the point the program hangs,
you would get something like this:
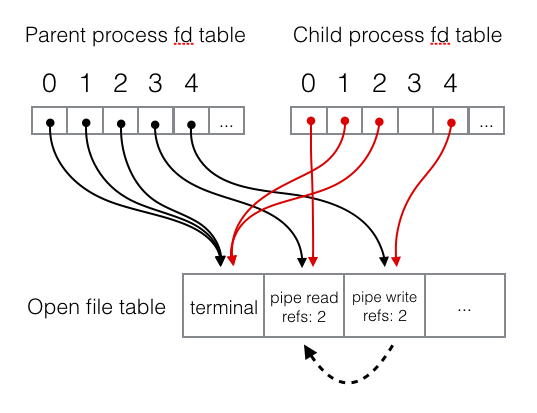
This diagram highlights our issue in a way that poring the code does not. The
sort process reads words until it reaches the “end of file” of stdin; when
stdin is coming from a pipe, this happens when the reference count for the
write end of the pipe reaches zero, indicating it is impossible for any more
data to be written to the pipe. However, the diagram shows that the sort
process itself has an extra file descriptor pointing to the write end of the
pipe, so even though the parent process has closed it, the reference count does
not reach 0 and “end of file” is not reached. Before calling execvp in the
child process, we forgot to close the write end of the pipe. Adding
close(fds[1]) after line 12 fixes the problem and makes the program run as
expected.
Those new to multiprocessing get tripped up by small issues such as these on a regular basis. Very often, only one line of code is missing or has an error, yet these mistakes cause huge functionality problems and can turn an otherwise-perfect program into one that does nothing more than your average rock. In office hours, when a student asks for help in fixing a broken program, we often ask them to walk through their program line-by-line, drawing a diagram as they go. Often, this leads them to fix their own problem without any further assistance from us; simply visualizing what is going on in their program is enough to figure out what is wrong with it. Other times, a student will misunderstand what a syscall does and will draw their diagram incorrectly. If they had a way to verify their understanding on their own, they would be able to identify their mistake much more quickly, but since there are so few tools to understand what their code is doing, they depend on the course staff to correct their understanding. As such, the wait time for office hours in CS 110 is sometimes very long (upwards of an hour), and it would be helpful for students to have better tools to understand where they are going wrong.
With this project, our goal was to build a tool that automatically generates these diagrams at any point in a program’s execution. We built this as a new feature in CPlayground, which is an online C/C++ sandbox I have been developing for a while. CPlayground allows a user to type any program, and then it will be executed with the output streamed in real time. If you have ever played with JSFiddle or a similar website, this is a similar concept: it allows users to quickly try out code, playing with various incantations to see what happens. With this project, we added a new pane below the terminal with a diagram showing the current state file descriptor table, file entry table, and vnode table, refreshed every second. You can see the CPlayground-generated diagram for our buggy example below, and other examples in the “Examples” section.
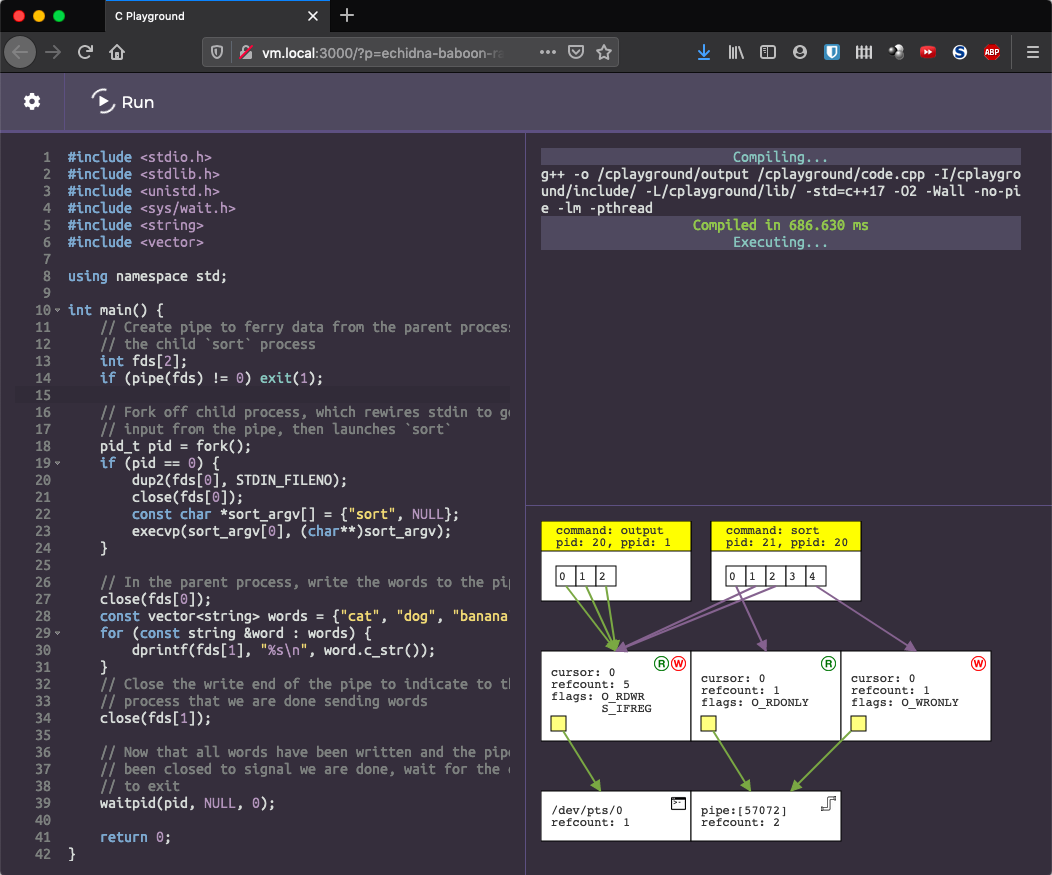
sort process has retained file descriptor 4 pointing at the write end of the pipe, preventing the pipe from being fully closed.Sourcing the data
Much of the data we need is already exposed by the kernel through the /proc
filesystem (sometimes called procfs). This is a virtual filesystem that
exposes information about currently-running processes. None of the files there
exist on disk, but when you read them, the kernel generates the file contents
on the fly. For example, you can list a process’s file descriptors by running
ls /proc/{pid}/fd/, and, as each file in that directory is a virtual symbolic
link pointing to the file addressed by the file descriptor, you can see where
each file descriptor points to:
🍉 ~ ls -l /proc/11139/fd/
total 0
lrwx------ 1 rebs operator 64 Dec 13 02:53 0 -> /dev/pts/6
lrwx------ 1 rebs operator 64 Dec 13 02:53 1 -> /dev/pts/6
lrwx------ 1 rebs operator 64 Dec 13 02:53 10 -> /dev/pts/6
lr-x------ 1 rebs operator 64 Dec 13 02:53 11 -> /dev/urandom
lrwx------ 1 rebs operator 64 Dec 13 02:53 12 -> socket:[30534982]
lr-x------ 1 rebs operator 64 Dec 13 02:53 14 -> /usr/share/zsh/functions/Completion.zwc
lrwx------ 1 rebs operator 64 Dec 13 02:53 2 -> /dev/pts/6
🍉 ~ readlink /proc/11139/fd/0
/dev/pts/9
You can get the cursor and flags from the open file table by reading the files in the fdinfo directory:
🍉 ~ cat /proc/11139/fdinfo/0
pos:	0
flags:	0100002
mnt_id:	22
However, although this data is very useful for constructing the desired
diagrams, it has a major limitation: Say there are two processes open, each
with a file descriptor pointing to /some/file. To complicate things, let’s
say that both file descriptors have a cursor of 0. Do these file descriptors
point to the same entry in the open file table (i.e. the file was opened, and
then the processes forked so the file descriptors were cloned)? Or, do the
file descriptors point to separate entries in the open file table, each of
which point to the same file in the vnode table (i.e. the two processes
opened the file independently)? This may seem like a trivial difference, but
in addition to producing visual differences in a diagram, the two scenarios
produce marked differences in behavior. In the first case, if the first process
reads some data from the file, the cursor (stored in the open file table, which
is shared between processes) will be advanced for both processes, and the
second process won’t see that data when it goes to read from the file. If these
reads are not synchronized, the file may appear corrupt to the second process.
In the second case, each process is using a separate entry in the open file
table and therefore has an independent cursor, so all reads and writes will
happen in isolation.
There is no way to resolve this ambiguity given the APIs the kernel exposes. I
spent a long time searching the internet for ways to check whether two file
descriptors are aliases for the same open file table entry, and then I decided
to read the Linux kernel source code that maintains pointers from the file
descriptor table into the open file table. As it turns out, entries in the open
file table are simple structs (called struct
file),
and the file descriptor table (struct
fdtable)
to these structs. Critically, struct file contains no unique identifiers, so
this makes me confident that there is no API anywhere that would allow us to
identify which open file table entry a file descriptor points to. From
userspace, the open file table is completely opaque.
This leaves two options: We can instrument each syscall, maintaining our own
data structures and updating them when syscalls are made using what we know
about the behavior of each syscall, or we can write code that goes through
kernel memory to extract the information we need. Although it seemed
intimidating at the time, we decided in favor of the latter option. There is
nothing worse than a debugger that works 95% of the time but provides incorrect
information 5% of the time, and we were not confident that we would be able to
correctly emulate the effect of every syscall on the file descriptor, open
file, and vnode tables, even in edge cases. The man page for open is nearly
700 lines long, and even features a “Bugs” section (as do many of the manpages
for other syscalls).
Linux provides support for loadable kernel modules that allow for writing
code that runs in the kernel without needing to compile a custom kernel
version. (Device drivers are a common example of LKMs.) We decided to implement
our data collection via a kernel module. Kernel modules are written in C, but
do not have access to libc (common functions such as malloc, printf, etc).
Instead, they have access to special kernel functions designed for operation in
kernel space (e.g. kmalloc allocates kernel memory, and printk “prints” to
the kernel logs) and structs that provide access to the privileged information
we need. How we designed this kernel module is a topic for another blog post,
but in summary, we first iterate over all processes looking for containerized
processes (since all CPlayground programs run in Docker containers). For each
containerized process task (of type struct task_struct), we look at the
file descriptor table in files_fdtable(task->files) and save some useful
information including the hash of the memory address of the struct file
each file descriptor points to. (This serves as an effective unique ID for
entries in the file entry table, without leaking information to userspace about
the layout of kernel memory.) This information is exposed to userspace via a
custom /proc file of our own (/proc/cplayground); when our NodeJS backend
reads this file every second, it gets the latest information about all
containerized processes. The NodeJS backend parses this file and reorganizes
it, adding reference counts to each entry in the open file and vnode tables,
and then it sends the relevant data to each client via a websocket so that it
can be diagrammed and displayed to the user.
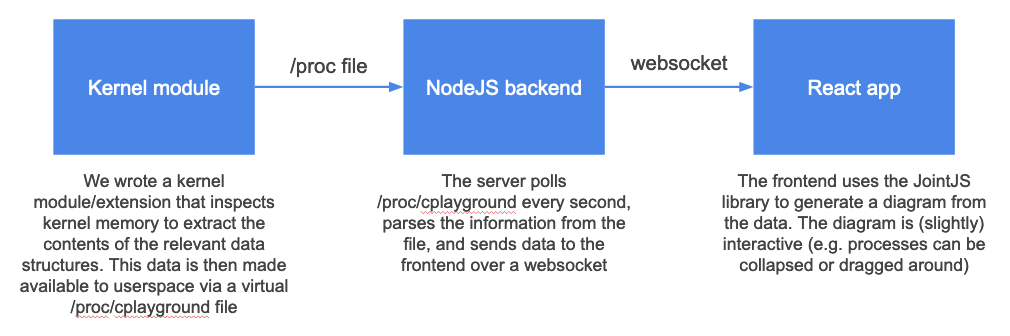
Rendering diagrams
The CPlayground frontend is a React app that uses
Socket.io (a layer on top of websockets) to stream
stdin/out to/from the backend. Socket.io is event-based: whenever the user
types a keystroke in the terminal, we send an event to the server containing
the keystrokes that were pressed, and whenever the running program outputs any
data to stdout, the server sends an event to the client containing that output.
To ferry data from server to client about the file descriptor, open file, and
vnode tables, we simply added a new debug event that the server sends
whenever it has new data available (i.e. every time it polls the
/proc/cplayground file).
To display this data to the user, we used JointJS, which is a general-purpose diagramming library that allows for drawing various shapes and connectors. Given data from the server, we draw the appropriate rectangles annotated with the appropriate text in order to draw the desired diagram.
Based on initial feedback, we made a few usability tweaks to the interface:
- File descriptor arrows are color-coded by process, so that it is easier to see which process has which files open in the potential mess of overlapping arrows.
- Open file table entries show a color-coded “R” or “W” icon in the top right,
indicating whether the session is read- or write-oriented. This is especially
helpful when working with pipes, since it’s not immediately obvious to a
beginner which end of the pipe is the write end. (This information is also
captured in the
flagsdisplayed in each open file, but it’s significantly harder to spot there.) - We added a terminal/pipe/file icon to the top right of each vnode as a quick indicator of file type. Again, this makes it easier to quickly understand what’s going on in the diagram.
Next quarter, we will be working on evaluating this interface in a classroom environment to see how we can make it even more intuitive.
Examples
Here is a video of CPlayground in action, running the toy sort example from
the “Teaching multiprocessing” section:
At 0:07, you can see the diagram illustrate a child process being spawned. As
explained earlier, the program fails to close the write end of the pipe in this
child process before running sort, which you can see from 0:08 to 0:12. At
0:12, the child process calls execvp to run sort, and you can see the
labeling of the child process change at that point. Finally, at 0:17, the
parent process writes the words to the pipe and closes the write end, signaling
to the child process that it is finished writing. However, you can see that the
child process still has a file descriptor pointing to the write end, so it
never realizes that the pipe has been closed, and it deadlocks, waiting for
more input. Then, in the video, we fix the problem and re-run the program. It
works correctly once a close(fds[1]) call is added.
An astute observer will notice g++ make a cameo appearance at 0:04. We think
this is a pretty neat artifact of this system: it works for any running
processes in the container and doesn’t depend on special instrumentation to
work.
An even cooler example shows how CPlayground can illustrate the pipes and files
being used by the sh shell:
This demonstration runs cat and pipes its output (i.e. whatever is typed into
the terminal) into cowsay. The cowsay program generates ASCII art showing a
cow saying whatever was typed. Its output (to stdout) is redirected into a
file, and then that file is subsequently dumped to the terminal via another
cat call. In the resulting diagram, you can see how a pipe is used to feed
the output of one program into the input of another, and how stdout can be
redirected to easily write output to a file. It works for any number of chained
processes in any configuration. Pretty neat!
What’s next?
In addition to visualization tools, we have also been working on building a
multi-process breakpoint debugger that would allow users to easily step through
code line-by-line. Right now, in order to pause at a part of the program long
enough to see a visualization of the state at that point, a user has to insert
a sleep() call. This isn’t very intuitive, and complicates the debugging
process. There aren’t any debuggers we know of that debug multiple processes
simultaneously, so this is challenging both from a technical and UI standpoint,
but we think it will greatly benefit students.
In addition, we would like to implement diagrams that visualize other parts of a running program. In writing the kernel module, we were also able to extract information about signals (e.g. what signals does a process have handlers installed for? what signals is it currently handling? what signals are queued but currently blocked?), and this is another area that would be helpful to visualize. We may also like to create a visual that is more focused on process state, showing relationships between processes more clearly (e.g. parent/child relationship, process groups, etc), and showing waiting behavior to help illustrate deadlock. At some point in the future, we may try building some visualizations for synchronization primitives in threading (beyond simply showing what threads are running), but this is not our current focus.
We would love to start making this available for students in CS 110 to use and to provide feedback on. Initial feedback has been extremely positive, and many CS 110 alumni have said they wished they had this tool when they were taking the class. After making a few iterations of improvements, we would also love to explore how CPlayground can be used to support other curricula at other schools. If you have thoughts on how we might take this further, please don’t hesitate to get in touch!
I'm Ryan, and I would love to hear from you. Send me an email or leave a comment below!

Interested in reading more articles like this one? Join my mailing list and I'll email you when I publish a new post! I typically post less than once a month.