Project 1: The DEET Debugger
In this project, you’ll implement the DEET debugger (Dodgy Eliminator of Errors and Tragedies) to get the deets on those pesky bugs in your code.

This project will give you practice with multiprocessing in Rust, and will give
you a better sense of how processes are managed by the operating system as well
as how ptrace can be used to circumvent process boundaries. While DEET is
simpler and less powerful than GDB, you’ll experience the mechanics that all
debuggers are based on. We welcome you to add your own features to build the
debugger that you would want to use!
This is a big and complex project that will synthesize everything you’ve learned so far. Please ask questions on slack if anything is unclear or if you’re feeling stuck/confused!
Logistics
This project is due on Thursday, May 13 at 11:59PM pacific time.
You may work with a partner if you would like. You can find partners in the #project-1 partner thread on Slack.
If you would be interested in working on a different project, let us know! This is a small class and we would love to support your individual interests.
Finally, please let us know if you run into any problems. It’s still very easy to get tripped up by Rust syntax and mechanics, and there are some nontrivial concepts at play here as well. We are here to help!
Working with a partner
If you work with a partner, only one person should submit. You should add a
comment to the top of main.rs including both partners’ names and sunet IDs
(Stanford usernames). Message us on Slack and we can add your partner to your
Github repository (or vice versa).
We strongly, strongly recommend that you do not simply split up the milestones below, but rather work together through all the work. This project is sufficiently complex that both of you need to understand all the parts involved, and we think you will benefit the most if you work closely with your partner to figure out how to solve problems and structure your code instead of working separately. If at all possible, try working together synchronously over an audio or video call.
Git is the industry-standard tool for collaborating on a codebase. Using it to collaborate is more difficult than using it as a sole developer (you’ll need to learn how to avoid and resolve merge conflicts when two people edit the same code at the same time). However, if you take time to learn how to use git properly, that experience will benefit you for years to come! Again, message us and we can add your partner to your Github repository (or vice versa).
However, git is mostly oriented for teams where people are working on different
parts of a codebase. Using it to collaborate on the same parts of the code at
the same time can be difficult, because doing so creates merge conflicts (you
edit Debugger, your partner edits Debugger, and then you try to sync your
changes and git doesn’t know what to do with the two sets of changes). From
my experience, the best way to collaborate synchronously is to use an editor
plugin that implements Google Docs-style sharing. Here are some that I found
from a quick Google search:
- VSCode: Live Share works extremely well. If you’re using VSCode, please give this a try!
- Floobits has plugins for IntelliJ, Sublime, Atom, and others. You can get free private workspaces by using an education account.
- CodeTogether is one I haven’t heard of before, but they’re offering all features for free during the COVID-19 pandemic. May be worth checking out if you don’t like the other options.
- TeamHub looks similar (I also have never tried it)
Tips for working with git
- A merge conflict happens when two people change the same part of a file (e.g.
the same function). It won’t happen if you make a change at the top of file A
and your partner makes a change at the bottom of file A. If possible,
coordinate changes with your partner so that you aren’t touching the same
code at the same time.
- That said, if a merge conflict happens, it’s not the end of the world. Merge conflicts are common, and there are great tools built for resolving them.
- Make frequent, small commits. A gigantic commit is very likely to create merge conflicts! Also, if you break something, it’s easier to go back and fix it if you’ve been making incremental commits along the way. You can always merge small commits into bigger ones, but you can’t easily split large commits into smaller ones.
- Write good commit messages. Not only will this help your partner understand the changes you made, but it will also help in resolving merge conflicts, since you can more quickly understand what changes are conflicting. Here’s an article about commit message style.
- Push and pull often. It’s always a nightmare when two people independently make a large number of changes, then attempt to push and are forced to resolve a stack of 15 commits.
- Say you have made some commits, and your partner just pushed their commits to
the server. You won’t be able to push your commits until you pull their
commits and reconcile them with your changes. If you run
git pull,gitwill download their commits and attempt to merge them with yours. If successful, it will commit a new “merge commit” that merges the two sets of changes. However, if you do this often, your git history will end up cluttered with merge commits. I prefer to rungit pull --rebase, which downloads your partner’s changes, then re-commits your changes on top of them. It avoids creating merge commits in the history. - Branches are a useful feature of git that allow contributors to establish separate “threads of development” in a codebase. However, since this project is small and since the milestones should be completed in order, we recommend against using branches here. If you’re curious (you will inevitably encounter branches in the future), this article gives a good summary, and this website has a great interactive visualization of how branches work.
Getting set up
You should have received an invite to join this project’s Github repository. If you didn’t get an email invite, try going to this link:
https://github.com/cs110l/proj1-YOURSUNETID
You can download the code using git as usual:
git clone https://github.com/cs110l/proj1-YOURSUNETID.git proj1
We recommend using a Linux system for development on this project.
Unfortunately, the interface of ptrace differs between Linux and BSD (e.g.
Mac) systems, and is not available on Windows. Additionally, different systems
store debugging symbols in different ways. While it is certainly possible to
extend your debugger to work on multiple platforms, we will only target Linux
here for simplicity.
If you’re on Linux, you can stop reading and just use cargo as you have in
previous exercises. If you’re on Mac or Windows, you can work on myth or
rice, or try one of the following local options:
Windows: Use WSL2
Newer versions of Windows include a feature called “Windows Subsystem for Linux,” which runs Linux inside of a virtual machine that can be conveniently accessed from your primary Windows OS.
To install WSL2, follow these instructions. Note that the older WSL1 is unlikely to work with this assignment.
Then, from a terminal, run wsl to get into a WSL 2 command prompt, and then
run the following:
# Install other dependencies:
sudo apt-get install -y build-essential make curl strace gdb
# Install Rust:
curl --proto '=https' --tlsv1.2 -sSf https://sh.rustup.rs | sh
If you’re using VSCode, you may also want to install the “Remote - WSL” extension.
Mac, or Windows without WSL 2: Use Vagrant
Vagrant is a really helpful tool that will create and configure virtual machines on your computer. This will allow you to easily run and test your code inside of a Linux VM.
First, you’ll want to install Vagrant.
On Mac with homebrew installed, you can do this easily by
running brew install --cask virtualbox vagrant. NOTE: If you’re on Mac
and get an error about “kernel driver not installed,” check out this
article.
(Thanks, Lyndsea, for the tip!)
Then, open the deet directory in your terminal and run the following to set
up the virtual machine:
cd deet
vagrant up
This will create and configure a Linux VM on your computer. Once it’s finished, you can get a terminal inside the VM by running:
vagrant ssh
Here, you can run normal commands like make, cargo run, or gdb samples/function_calls. Any changes you make to the project on your computer
will be automatically synchronized with the VM, so you don’t need to worry
about copying any files or restarting anything as you work.
After you’re done with this project, you can shut down and delete the VM using this command:
vagrant destroy
Fallback option: Use Docker
NOTE: Compilation times via Docker were nearly a minute on my machine in testing this assignment. It seems like the compilation cache may not be performing very well. This will likely lead to a very frustrating experience on this assignment, so I would advise not going this route unless you really want to.
Docker is a popular tool that creates consistent environments to develop/test/deploy software in. (C Playground runs each program in a Docker container!) It may take some more work to get running, but will probably be more smooth in terms of running your code.
Installing Docker
On Mac, you can download and install Docker here. Easy peasy.
You can also use Docker on Windows, although I recommend only doing so with WSL2 (and if you’re going to do that, it might be easier to just use the earlier WSL2 instructions).
Building the Docker image
cd into the deet/ directory, and then run docker build:
docker build -t deet .
This will build an deet image containing dependencies needed to run your
program. This might take a while. (In our case, the dependencies are just a
barebones version of Ubuntu, cargo, and make.)
Once you build this image, you won’t need to do it again!
Running cargo
Once the image is built, you can run your code. Here’s a pretty long
incantation that runs cargo build in your Docker image:
docker run --rm -it \
    -v "${PWD}":/deet -v "${PWD}/.cargo":/.cargo \
    -u $(id -u ${USER}):$(id -g ${USER}) \
    deet \
    cargo build
Since this is rather long and complex, we included a mini script that does the
docker run part for you. You can run it like this:
./container cargo build
./container cargo run
You can edit code locally on your machine using whatever editor you like and
run the ./container command to run your code. No need to upload or sync your
files anywhere.
You can also run other things within the container. For example, you can run make and gdb:
./container make
./container gdb samples/function_calls
Or, you can even start a bash shell inside the container:
./container bash
Milestone 0: Read the starter code
This is the first large project in CS 110L, and it may be one of your first times working with a more substantial codebase. Take some time to orient yourself with the starter code, writing/drawing things out as necessary.
There are a few files you should be aware of:
main.rsis a short file that serves as the entrypoint for the program. You won’t need to make any changes here.debugger.rscontains the code that implements the command-line interface for DEET. You’ll be making a lot of changes here.debugger_command.rscontains some code for parsing commands that are typed into DEET. Any time you add a new command, you’ll need to add code here.inferior.rscontains code to manage child processes being run by the debugger. As you add features that involve controlling the program being debugged, you will need to add code here.dwarf_data.rscontains a series of helper functions for extracting debugging symbols (e.g. line numbers, variable names, function names) from the executable being debugged. You won’t need to make any changes here, but you will need to use these functions in Milestone 3.gimli_wrapper.rscontains functions that are used to read debugging symbols from a binary file. It is messy code patched together from several Gimli examples; please don’t read it :) (unless you plan to do an extension and need to collect more information from the dwarf file)
In addition, we have provided a series of sample programs that you can use to
test your debugger. These programs are written in C and are in the samples/
directory, although we’d like to note that you could use DEET to debug Rust
programs as well!
You should run make to compile the sample programs before proceeding.
⚠️ If you’re using Vagrant or Docker, be careful to run make inside the
VM/container instead of in your regular terminal, or else you might compile
Windows or MacOS executables instead of Linux ones, causing confusion later on
:) ⚠️
Milestone 1: Run the inferior
In this milestone, you will modify the debugger to start an inferior. An inferior is a process that is being traced by the debugger. (Debuggers are apparently just a tad bit narcissistic!)
Currently, code in debugger_command and debugger extracts arguments from
the r command and passes them to Inferior::new:
🍌 cargo run samples/sleepy_print
   Compiling deet v0.1.0 (/deet)
    Finished dev [unoptimized + debuginfo] target(s) in 13.41s
     Running `target/debug/deet samples/sleepy_print`
(deet) r 3
Inferior::new not implemented! target=samples/sleepy_print, args=["3"]
Error starting subprocess
(deet)
Your first job is to implement Inferior::new to spawn a child process running
our target program. This child process should have debugging enabled, which you
can accomplish using the ptrace syscall: the child process can call ptrace
with PTRACE_TRACEME after fork() but before exec, telling the operating
system “hey! please allow my parent process to trace my execution.”
In Inferior::new, you should do the following things:
- Create a Command
to
spawnthe target program with the provided arguments. - Before calling
spawn()on the command, usepre_execto callchild_tracemein the child process. See the lecture 11 slides for example usage ofpre_exec. Note that you mustuse std::os::unix::process::CommandExt;at the top of the file in order to be able to callpre_exec. - When a process that has
PTRACE_TRACEMEenabled callsexec, the operating system will load the specified program into the process, and then (before the new program starts running) it will pause the process usingSIGTRAP. You should callwaitpidon the child process to verify that it stops with signalSIGTRAP, in order to verify that everything is in working order (if this check fails, simply returnNone). You are welcome to callwaitpiddirectly, or to use theInferior::waitmethod that we have provided. - Once you have verified that the child process seems to be in working order,
you can construct an
Inferiorand return it!
As mentioned, PTRACE_TRACEME causes programs to start in a stopped state.
Once you are constructing Inferior objects, you’ll need a way to start
program execution.
We would recommend implementing a “continue” method on Inferior (you can’t
call it continue, since that’s a reserved keyword). This method should wake
up the inferior and wait until it stops or terminates. To wake up the inferior,
you can use
ptrace::cont (pass
None for sig), and to wait, you can use self.wait(None). Our continue
method returns Result<Status, nix::Error> in order to pass on the resulting
program status and any errors to the caller. (We use ? syntax to simplify
error handling.)
You’ll need to update Debugger::run to call this continue method after it
constructs an Inferior. You should use the status returned from your continue
method to print a message about the status of the inferior.
Expected outcomes:
- You can start inferiors and pass arguments using the
runcommand - When an inferior stops or terminates, the debugger should print a message (e.g. Child exited (status 0))
- You can run a program multiple times within a debugging session
Example output:
🍌 cargo run samples/sleepy_print
    Finished dev [unoptimized + debuginfo] target(s) in 1.94s
     Running `target/debug/deet samples/sleepy_print`
(deet) r 3
0
1
2
Child exited (status 0)
(deet) r 3
0
1
2
Child exited (status 0)
(deet)
Milestone 2: Stopping, resuming, and restarting the inferior
Sometimes, when a process deadlocks, it is helpful to temporarily stop it, poke around (e.g. print a backtrace to see where it is deadlocked), then resume it. In this milestone, we will add the ability to pause and resume an inferior.
As it happens, our debugger already has the ability to pause an inferior.
Normally, SIGINT will terminate a process, but if a process is being traced
under ptrace, SIGINT will cause it to temporarily stop instead, as if it
were sent SIGSTOP. (The same is true for all signals that typically terminate
a process. This is useful for debugging: if a program segfaults but is being
traced under ptrace, the program will stop instead of terminating so that you
can get a backtrace and inspect its memory.) You can try this out: run
samples/sleepy_print under your debugger with the argument 5. Press
ctrl+c, and the program will stop.
Now, we need a way to resume a stopped process. Let’s add a continue command,
similar to the one GDB has.
To add a command, you’ll need to add an enum variant to DebuggerCommand in
debugger_command.rs, and you’ll need to update DebuggerCommand::from_tokens
to return your new variant when c, cont, or continue are typed in DEET.
Then, update Debugger::run to continue the inferior when the continue
command is typed. (You can use your continue method from the previous
milestone!) Your continue command should print the status of the inferior
when it stops or terminates next, similar to the run command.
🍌 cargo run samples/sleepy_print
    Finished dev [unoptimized + debuginfo] target(s) in 2.56s
     Running `target/debug/deet samples/sleepy_print`
(deet) run 5
0
1
^CChild stopped (signal SIGINT)
(deet) cont
2
3
^CChild stopped (signal SIGINT)
(deet) cont
4
Child exited (status 0)
(deet)
Note that there are some edge cases you should handle: What happens if you type
continue before you type run? Your implementation should check whether an
inferior is running, and print an error message if there is not one running.
Also, what happens when you pause an inferior using ctrl+c, then type run?
You should take care to kill any existing inferiors before starting new ones,
so that there is only one inferior at a time. You can use
Child::kill
to kill a process, and then you’ll need to reap the killed process. (We added
an Inferior::kill method and called this from Debugger::run, although you
are not required to do so.)
Similarly, what happens if you exit DEET while a process is paused? You should
update the handling of DebuggerCommand::Quit to terminate the inferior if one
is running.
(deet) run 5
0
1
^CChild stopped (signal SIGINT)
(deet) quit
Killing running inferior (pid 216)
If you want to test your management of child processes, use DEET to start a
sleepy_print inferior, pause it, start a new inferior, and pause that second
inferior. In a separate terminal, run ps aux | grep sleepy_print (or
docker exec deet ps aux | grep sleepy_print if you are using docker). There
should only be one samples/sleepy_print process. If you see multiple, or you
see a <defunct> entry, then you are not killing or reaping child processes
properly.
🍌 cargo run samples/sleepy_print
   Compiling deet v0.1.0 (/deet)
    Finished dev [unoptimized + debuginfo] target(s) in 29.80s
     Running `target/debug/deet samples/sleepy_print`
(deet) run 5
0
1
^CChild stopped (signal SIGINT)
(deet) run 5
Killing running inferior (pid 204)
0
1
^CChild stopped (signal SIGINT)
(deet)
# Note: Run "ps aux | grep sleepy_print" if you aren't using Docker
🍌 docker exec deet ps aux | grep sleepy_print
501          1  0.6  0.2  16292  4448 pts/0    Ss+  10:29   0:00 target/debug/deet samples/sleepy_print
501        210  0.0  0.0   4504   704 pts/0    t+   10:29   0:00 samples/sleepy_print 5
Expected outcomes:
- You can pause an inferior using
ctrl+c. - You can resume an inferior using
continue. - Inferiors can be paused/resumed several times.
- The status of the inferior is printed whenever it stops/terminates.
- At most one inferior process exists at any time. No zombie processes!
- Any running inferior is terminated when the debugger quits.
Milestone 3: Printing a backtrace
In this milestone, you’ll implement code to print a stack trace for a paused program.
Define a new DebuggerCommand that is returned when the user types bt,
back, or backtrace. For starters, define a method print_backtrace(&self) -> Result<(), nix::Error> in Inferior that prints “hello world,” and call
this method when the user types a backtrace command. Test this out to ensure
that your debugger is able to read and process the backtrace command.
Once you have done this, let’s move onto implementing print_backtrace.
As a first step, let’s print out the value of the %rip register. This value
is the address of the instruction in the text segment that we are executing.
You can use
ptrace::getregs
to get the inferior’s register values. Use println!("{:#x}", ...) to print
the register value in hexadecimal. Note that you may see a different value than
us depending on the machine you are compiling on.
🍌 cargo run samples/segfault
    Finished dev [unoptimized + debuginfo] target(s) in 2.61s
     Running `target/debug/deet samples/segfault`
(deet) run
Calling func2
About to segfault... a=2
Child stopped (signal SIGSEGV)
(deet) back
%rip register: 0x400b95
(deet)
Great, we’re printing something! But this isn’t very meaningful. In order to be useful, a backtrace should show function names and line numbers so that a programmer can see which parts of their program is running. However, a running executable is comprised only of assembly instructions and has no awareness of function names or line numbers. In order to print such information, we need to read extra debugging symbols that are stored within an executable compiled for debugging. This debugging information stores mappings between addresses and line numbers, functions, variables, and more. With this information, we can find where variables are stored in memory or figure out what line is being executed based on the value of the processor’s instruction pointer.
On many platforms, debugging symbols are stored in a format called DWARF and
embedded inside the executable file. In developing this assignment, we
discovered that DWARF is extremely complicated, and there are not yet any good
high-level DWARF parsers in Rust. In order to avoid subjecting you to the same
pain we went through, we have provided you with some functions in
dwarf_data.rs that you can use in your debugger implementation.
To use these functions, you should first add these two lines to main.rs:
mod dwarf_data;
mod gimli_wrapper;
Then, in debugger.rs,
use crate::dwarf_data::{DwarfData, Error as DwarfError}, and at the beginning
of Debugger::new, load the target executable file:
let debug_data = match DwarfData::from_file(target) {
    Ok(val) => val,
    Err(DwarfError::ErrorOpeningFile) => {
        println!("Could not open file {}", target);
        std::process::exit(1);
    }
    Err(DwarfError::DwarfFormatError(err)) => {
        println!("Could not load debugging symbols from {}: {:?}", target, err);
        std::process::exit(1);
    }
};
You should store debug_data inside the Debugger struct. Then, in
Debugger::run, pass debug_data to your print_backtrace method, so that we
can access it when trying to get human-readable information.
Let’s update print_backtrace to be more helpful. Armed with your %rip
value, use DwarfData::get_line_from_addr to get the file name and line number
corresponding to the current instruction, and use
DwarfData::get_function_from_addr to get the function name. Print out this
information, and you will have the start of something useful:
👾 cargo run samples/segfault
    Finished dev [unoptimized + debuginfo] target(s) in 2.43s
     Running `target/debug/deet samples/segfault`
(deet) r
Calling func2
About to segfault... a=2
Child stopped (signal SIGSEGV)
(deet) back
func2 (/deet/samples/segfault.c:5)
(deet)
Amazing!
We can now see where the program is stopped, but we want to show a full stack
trace: what function called func2, and what functions came before that? To
figure this out, we need to understand a bit more about how the stack is laid
out.
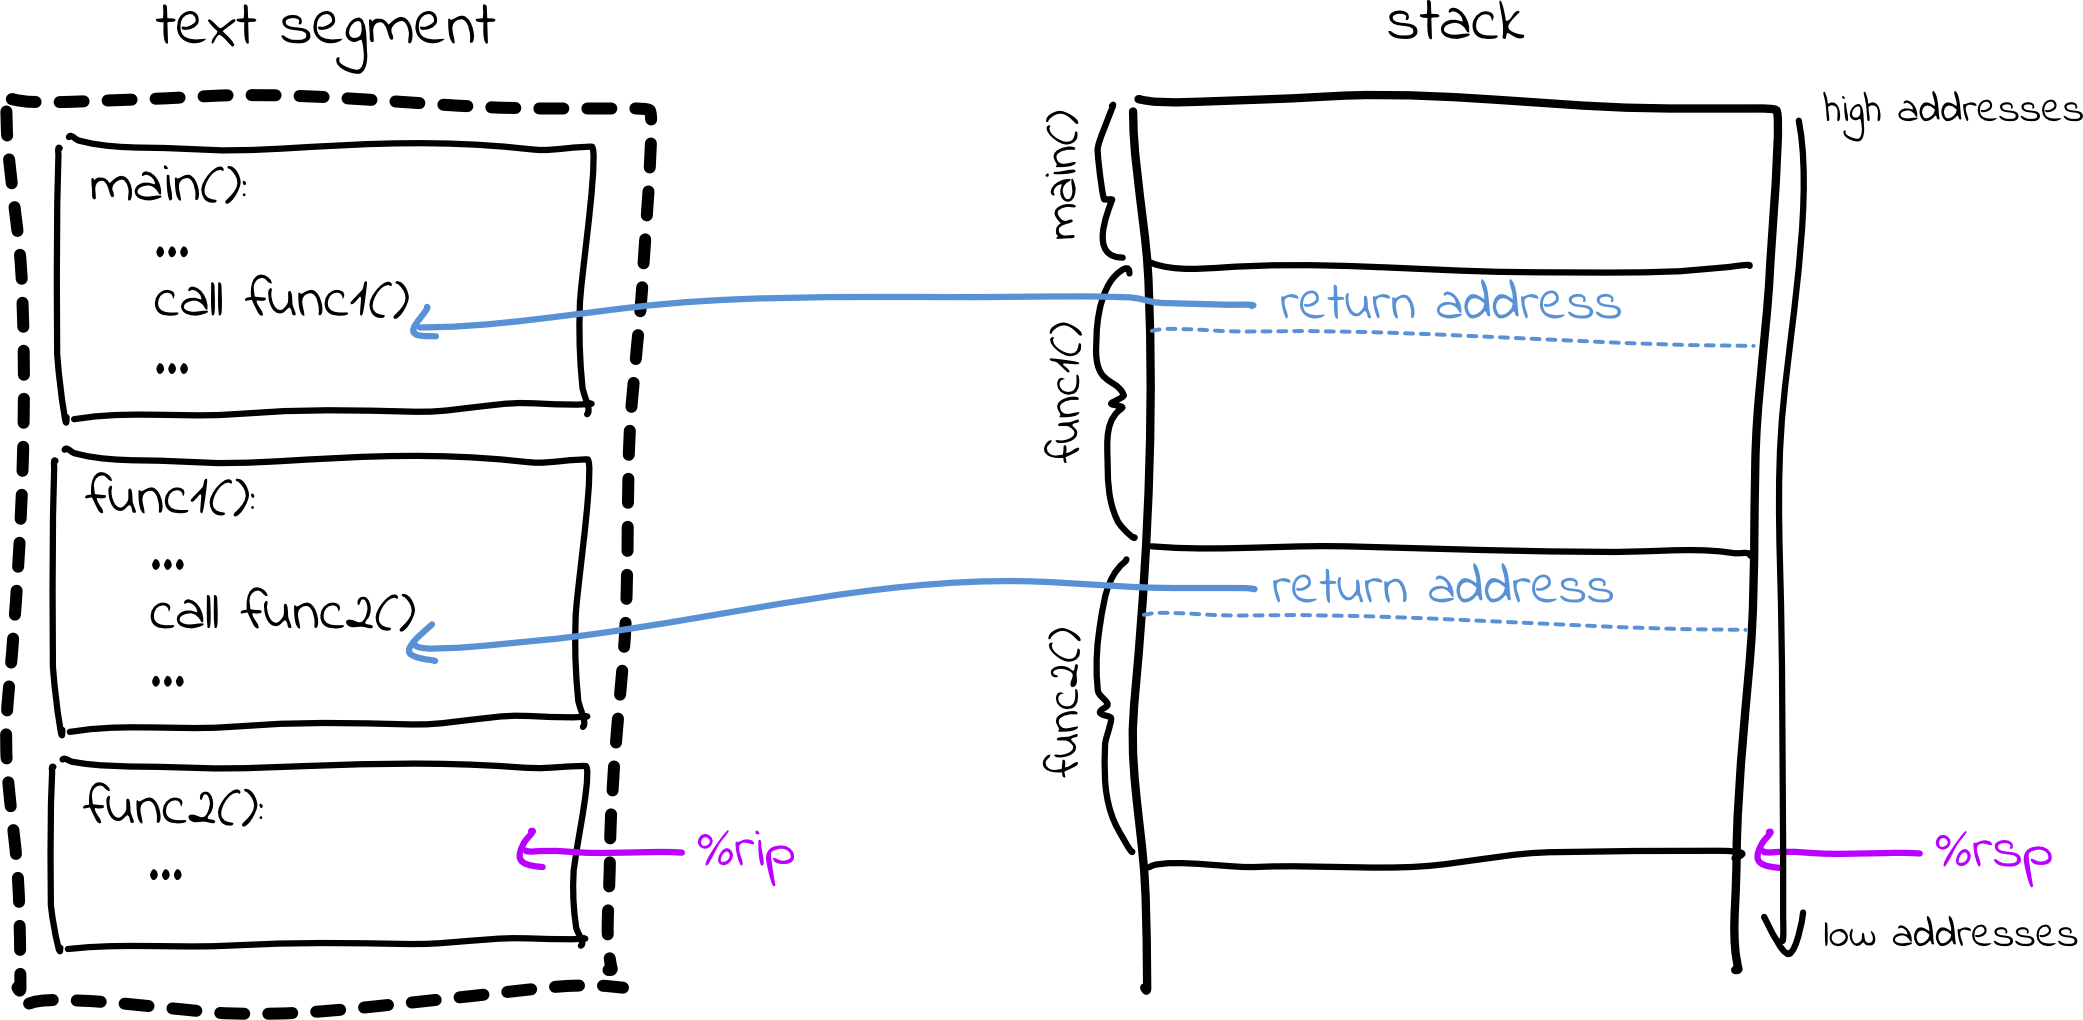
The stack consists of stack frames, where each function’s local variables are placed in its own stack frame. At the top of each stack frame is a return address, which stores the address in the text segment where we should go to after returning from this function.
When printing a backtrace, we do so using the return addresses. First, we print
the line number corresponding to %rip (where we are currently executing).
Then, we print the line number corresponding to the return address of our
current stack frame. Then, we print the line number for the return address of
the previous stack frame, and so on, until we reach the main function.
This may sound simple, but we have a problem: How do we actually find the top
of the current stack frame? There are no registers that point to the top of the
stack frame, nor is there any information in the executable telling us how
large the stack frame is. (Those familiar with assembly may be familiar with
%rbp, the base pointer register, which used to serve this purpose but is no
longer consistently available, for performance reasons.)
To solve this problem, we can once again rely on DWARF debugging information to
figure out how big the stack frame is given which function we are currently
executing. The concrete mechanics for this are pretty complicated, but we have
provided you with a DebugInfo::get_frame_start_address method that does this
for you.
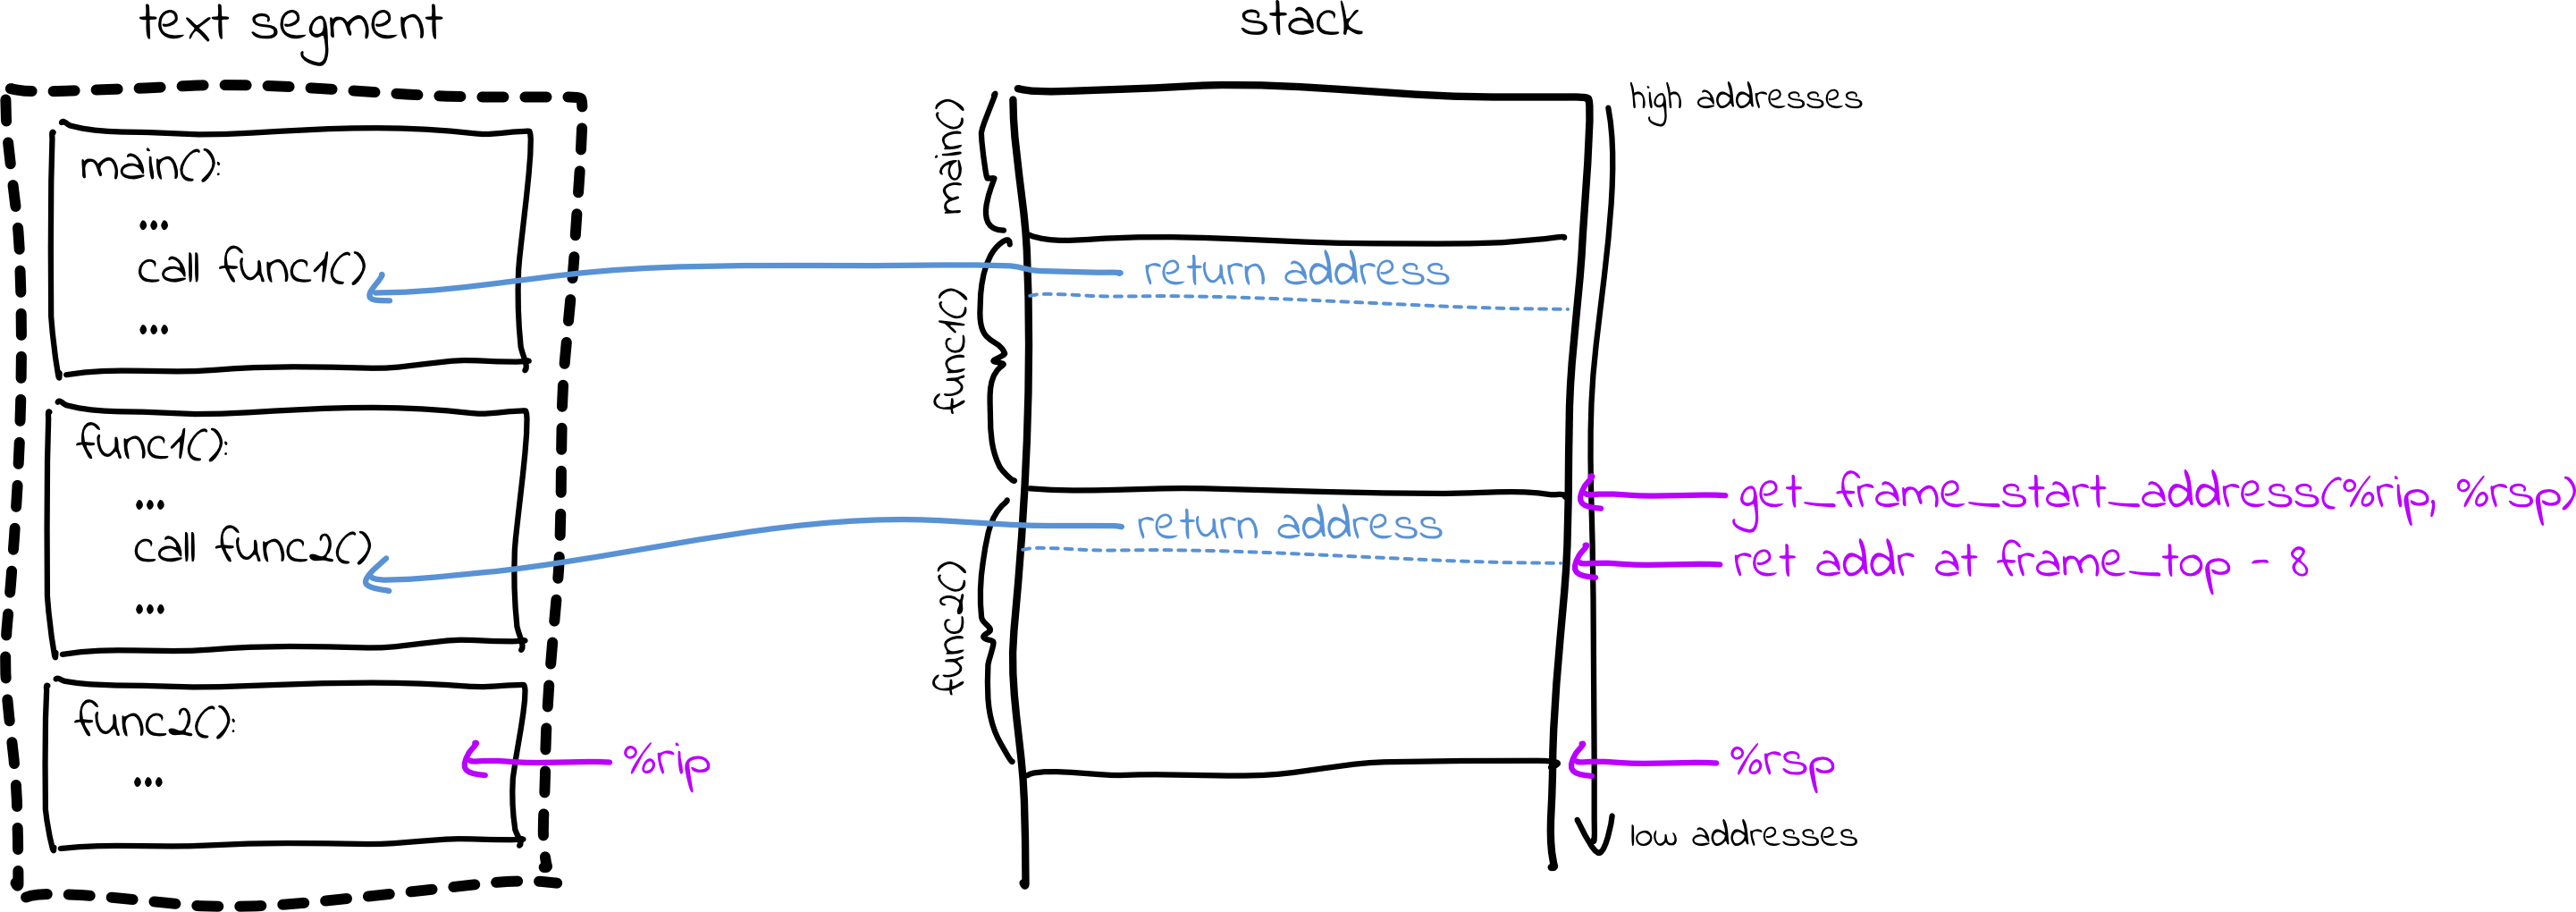
debug_info.get_frame_start_address() will return the address of the stack
frame, so you can find the address of the return address by subtracting 8.
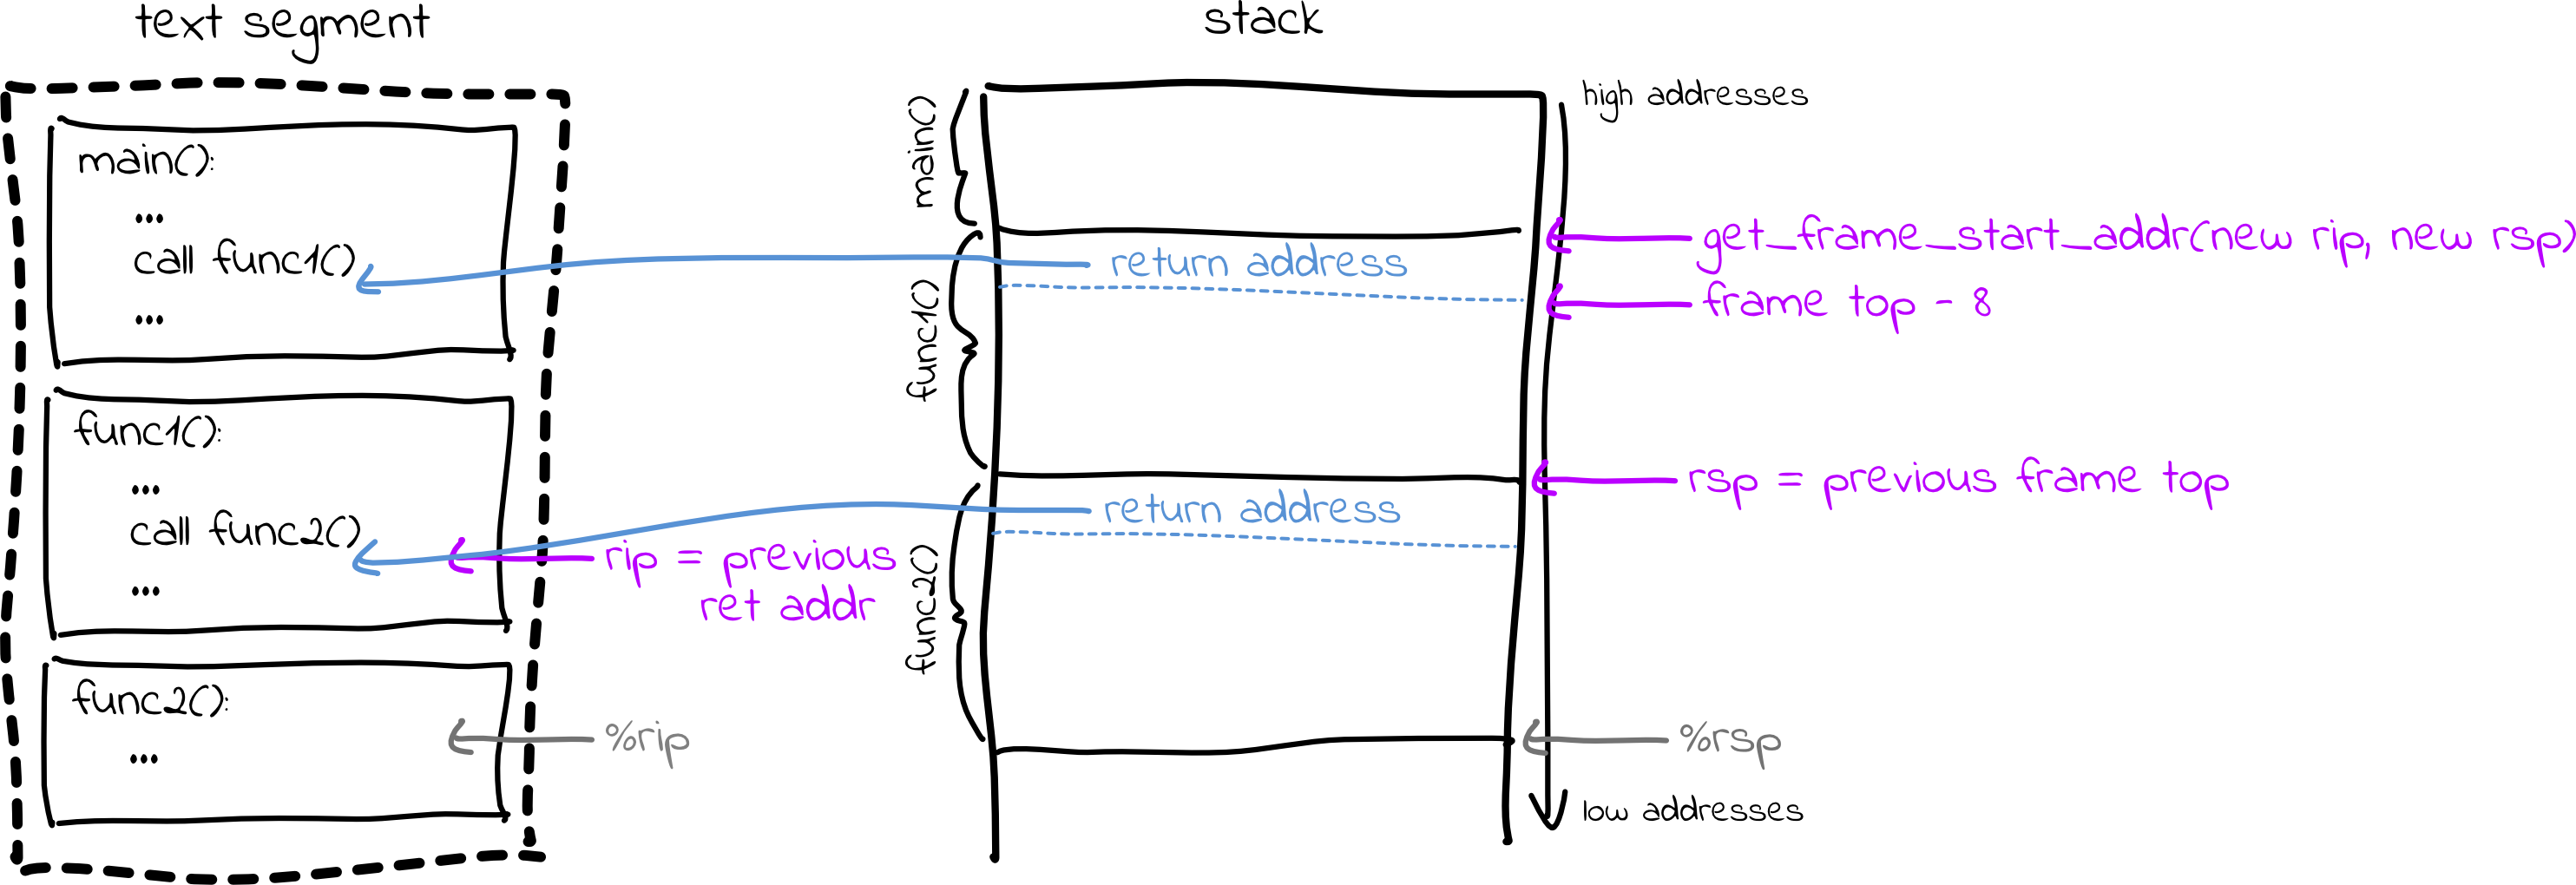
Then, you can read the return address using ptrace::read. This value becomes
the instruction pointer (rip) for the previous stack frame, and the top of
the frame returned by get_frame_start_address becomes the stack pointer
(rsp) for the previous stack frame. With these new rip and rsp values, we
can call get_frame_start_address again to get the top of the previous stack
frame, use that to get the return address, and repeat the process, working our
way up the stack!
Codifying this process, we can implement a backtrace like this:
instruction_ptr = %rip
frame_bottom = %rsp
while true:
    print function/line number for instruction_ptr
    if function == "main":
        break
    frame_top = get_frame_start_address(instruction_ptr, frame_bottom)
     -> if you can't find the top of the frame, print an error, e.g.
        "Warning: unknown stack frame layout, can't unwind further",
        and break out of this loop
    instruction_ptr = read memory at frame_top - 8
    frame_bottom = frame_top
To read memory, you can use ptrace::read:
instruction_ptr = ptrace::read(self.pid(), addr_to_read as ptrace::AddressType)? as u64;
When this is done, you should be able to print a full backtrace:
👾 cargo run samples/segfault
    Finished dev [unoptimized + debuginfo] target(s) in 2.43s
     Running `target/debug/deet samples/segfault`
(deet) r
Calling func2
About to segfault... a=2
Child stopped (signal SIGSEGV)
Stopped at /deet/samples/segfault.c:5
(deet) back
func2 (/deet/samples/segfault.c:5)
func1 (/deet/samples/segfault.c:12)
main (/deet/samples/segfault.c:15)
(deet)
Milestone 4: Print stopped location
When an inferior stops, GDB prints the file/line number that it stopped at. This is extremely helpful when dealing with breakpoints and step debugging, which we will tackle in the next few milestones.
You may have noticed that Status::Stopped includes a u64 containing the
value of %rip for the stopped process. Modify your Debugger implementation
such that when the inferior stops, if line number information is available from
DwarfData::get_line_from_addr, DEET prints the line number where the program
stopped. If you’re up for it, you can print the function name as well!
🍌 cargo run samples/segfault
    Finished dev [unoptimized + debuginfo] target(s) in 2.07s
     Running `target/debug/deet samples/segfault`
(deet) r
Calling func2
About to segfault... a=2
Child stopped (signal SIGSEGV)
Stopped at /deet/samples/segfault.c:5
(deet)
Milestone 5: Setting breakpoints
In this milestone, we’ll allow a user to set a breakpoint at a specific memory
address using a command like break *0x123456 (or b *0x123456 for short).
First, update DebuggerCommand and Debugger to parse a break command. We
recommend storing a simple String target in the DebuggerCommand enum
variant, and then do more sophisticated parsing (e.g. ensure the target string
starts with *, and extract the address as a u64 from the string) in
Debugger. This is because in Milestone 6, you will be updating this code to
take different kinds of breakpoints, e.g. breakpoints on function names or line
numbers.
You may use this code to parse a u64 from a hexadecimal string:
fn parse_address(addr: &str) -> Option<u64> {
    let addr_without_0x = if addr.to_lowercase().starts_with("0x") {
        &addr[2..]
    } else {
        &addr
    };
    u64::from_str_radix(addr_without_0x, 16).ok()
}
Note that users should be able to set breakpoints before any inferior is
running. (If you make them run the inferior first, it will likely exit before
they are able to set breakpoints.) As such, you should store set breakpoints in
a Vec<u64> in the Debugger struct. When a user types break *0x123456,
you should add 0x123456 to the list of set breakpoints.
(deet) b *0x123456
Set breakpoint 0 at 0x123456
Our implementation prints out a confirmation message along with a breakpoint number, but this is not required.
When creating an Inferior, you should pass Inferior::new a list of
breakpoints. In Inferior::new, after you wait for SIGTRAP (indicating that
the inferior has fully loaded) but before returning, you should install these
breakpoints in the child process.
How does one set a breakpoint on a process? The answer is more hacky than you
might expect, yet this is exactly how GDB works. To set a breakpoint on the
instruction at 0x123456, simply use ptrace to write to the child process’s
memory, replacing the byte at 0x123456 with the value 0xcc. This
corresponds to the INT (“interrupt”) instruction; any process that runs this
instruction is temporarily halted.
This is simple in concept but slightly challenging in practice because ptrace
does not support writing single bytes to a child’s memory. In order to write a
byte, you must read a full 8 bytes into a long, use bitwise arithmetic to
substitute the desired byte into that long, and then write the full long
back to the child’s memory. Additionally, despite the nix crate’s ptrace
having a much nicer interface than the ptrace syscall, it’s still a bit funky
to use (it requires some bizarre type conversions). As such, we would rather
you not spend time on trying to figure out how to do this. You may use the
following code:
use std::mem::size_of;

fn align_addr_to_word(addr: u64) -> u64 {
    addr & (-(size_of::<u64>() as i64) as u64)
}

impl Inferior {
    fn write_byte(&mut self, addr: u64, val: u8) -> Result<u8, nix::Error> {
        let aligned_addr = align_addr_to_word(addr);
        let byte_offset = addr - aligned_addr;
        let word = ptrace::read(self.pid(), aligned_addr as ptrace::AddressType)? as u64;
        let orig_byte = (word >> 8 * byte_offset) & 0xff;
        let masked_word = word & !(0xff << 8 * byte_offset);
        let updated_word = masked_word | ((val as u64) << 8 * byte_offset);
        ptrace::write(
            self.pid(),
            aligned_addr as ptrace::AddressType,
            updated_word as *mut std::ffi::c_void,
        )?;
        Ok(orig_byte as u8)
    }
}
You can test this by modifying Debugger::new to call debug_data.print().
This will print out a list of locations in the loaded binary. You can set a
breakpoint on one of these locations, and the program should stop there with a
SIGTRAP. For example, below, I set a breakpoint at the beginning of func2
(where the segfault is triggered), which happens to be at 0x400b6d for my
particular compiler. When I run the program, it does not segfault (since the
breakpoint was before the line that causes the segfault), and DEET prints that
it stopped on line 3.
👾 cargo run samples/segfault
   Compiling deet v0.1.0 (/deet)
    Finished dev [unoptimized + debuginfo] target(s) in 30.75s
     Running `target/debug/deet samples/segfault`
------
samples/segfault.c
------
Global variables:
Functions:
  * main (declared on line 14, located at 0x400bed, 24 bytes long)
  * func1 (declared on line 9, located at 0x400ba9, 68 bytes long)
    * Variable: a (int, located at FramePointerOffset(-20), declared at line 9)
  * func2 (declared on line 3, located at 0x400b6d, 60 bytes long)
    * Variable: a (int, located at FramePointerOffset(-20), declared at line 3)
Line numbers:
  * 3 (at 0x400b6d)
  * 4 (at 0x400b75)
  * 5 (at 0x400b8c)
  * 6 (at 0x400b97)
  * 7 (at 0x400ba3)
  * 9 (at 0x400ba9)
  * 10 (at 0x400bb1)
  * 11 (at 0x400bbd)
  * 12 (at 0x400be7)
  * 14 (at 0x400bed)
  * 15 (at 0x400bf1)
  * 16 (at 0x400c00)
(deet) break *0x400b6d
Set breakpoint 0 at 0x400b6d
(deet) r
Calling func2
Child stopped (signal SIGTRAP)
Stopped at /deet/samples/segfault.c:3
(deet)
Expected outcomes:
- Users should be able to use
break *addrto set breakpoints before an inferior starts running - When the inferior starts running,
0xccshould be written to the address of each breakpoint - Users should be able to use
break *addreven after an inferior has started running (e.g. you should be able to ctrl+c on a sleeping program and set a breakpoint).
Debugging note: If you get an ESRCH error (no matching process found) while
trying to set a breakpoint, make sure you are waiting for the child process to
stop (and ensuring it stopped, rather than exiting or being signalled). If you
don’t call wait() before setting breakpoints in Inferior::new, then it’s
possible you’ll try to set breakpoints before the child process has started
running.
Milestone 6: Continuing from breakpoints
Continuing from a breakpoint is as simple and as hacky as setting a breakpoint was.
When we have “hit a breakpoint,” the inferior has executed the 0xcc INT
instruction, causing the inferior to pause (due to SIGTRAP). However, the
0xcc instruction overwrote the first byte of a valid instruction in the
program. If we continue execution from after 0xcc, we will have skipped a
legitimate instruction. Worse, many instructions are multiple bytes long. If we
set a breakpoint on a multi-byte instruction and continue execution as is, the
CPU will attempt to interpret the second byte of the instruction as a new,
separate instruction. It’s likely the program will crash due to a segfault or
illegal instruction error.
In order to continue from a breakpoint, we need to replace 0xcc with the
original instruction’s value. Then, we need to rewind the instruction pointer
(%rip) so that it points at the beginning of the original instruction
(instead of pointing one byte in).
After doing this, we can resume execution. However, our breakpoint is no longer
in the code, since we have swapped 0xcc for the real instruction. If we had
set a breakpoint in a loop or in a function that is called multiple times, this
is not ideal!
This problem is addressed with yet another hack. After replacing 0xcc with
the original instruction’s first byte, we tell ptrace to continue by just one
instruction, instead of completely resuming execution. Then, once the inferior
has executed the full instruction, we replace it with 0xcc again to restore
the breakpoint. Finally, we call ptrace::cont as usual to resume execution.
Here is pseudocode to implement these strategies in a “continue” method. I have reordered the above to make it slightly easier to implement, but the substance is the same:
if inferior stopped at a breakpoint (i.e. (%rip - 1) matches a breakpoint address):
    restore the first byte of the instruction we replaced
    set %rip = %rip - 1 to rewind the instruction pointer
     -> Be sure to call ptrace::setregs to update the actual register in the child process
    ptrace::step to go to next instruction
    wait for inferior to stop due to SIGTRAP
     -> (if the inferior terminates here, then you should return that status and
        not go any further in this pseudocode)
    restore 0xcc in the breakpoint location

ptrace::cont to resume normal execution
wait for inferior to stop or terminate
Evidently, to do this, you’ll need to keep track of the breakpoints that are
installed, as well as the instructions they replaced. You can do this however
you like. We maintain a HashMap<u64, u8> mapping breakpoint addresses
(u64) to original instruction values (u8).
Expected outcomes:
- Users should be able to set breakpoints at instructions and continue onwards from them.
Debugging tip:
We recommend printing a disassembly of the function where you’re setting a
breakpoint. For example, if you’re setting a breakpoint in func2, you should
run:
gdb -batch -ex "disassemble/rs func2" samples/segfault
This will allow you to see addresses where valid assembly instructions are. For example, based on my output, I see instructions at 0x400b6d, 0x400b71, 0x400b75, and so on. (Your output will vary based on your compiler/version.)
Every time you call write_byte, print the address you’re writing to, and
every time your inferior is stopped (e.g. after a self.wait() call), print
out ptrace::getregs(self.pid())?.rip to see where the inferior is executing.
If you accidentally set the instruction pointer incorrectly, you might end up
setting rip to point in between instructions, or maybe to the wrong place
entirely. If you disassemble the binary to see where the valid instructions
are, and frequently print out rip to see what is being executed, you’ll have
an easier time pinpointing these kinds of problems.
Example output:
As an example, here I run samples/segfault, setting initial breakpoints on
lines 15 and 10, then (after running the inferior and hitting the first
breakpoint) adding another breakpoint at line 5. You can see that I hit each of
the three breakpoints before the program eventually segfaults.
🍌 cargo run samples/segfault
    Finished dev [unoptimized + debuginfo] target(s) in 2.04s
     Running `target/debug/deet samples/segfault`
------
samples/segfault.c
------
Global variables:
Functions:
  * main (declared on line 14, located at 0x400bed, 24 bytes long)
  * func1 (declared on line 9, located at 0x400ba9, 68 bytes long)
    * Variable: a (int, located at FramePointerOffset(-20), declared at line 9)
  * func2 (declared on line 3, located at 0x400b6d, 60 bytes long)
    * Variable: a (int, located at FramePointerOffset(-20), declared at line 3)
Line numbers:
  * 3 (at 0x400b6d)
  * 4 (at 0x400b75)
  * 5 (at 0x400b8c)
  * 6 (at 0x400b97)
  * 7 (at 0x400ba3)
  * 9 (at 0x400ba9)
  * 10 (at 0x400bb1)
  * 11 (at 0x400bbd)
  * 12 (at 0x400be7)
  * 14 (at 0x400bed)
  * 15 (at 0x400bf1)
  * 16 (at 0x400c00)
(deet) break *0x400bf1
Set breakpoint 0 at 0x400bf1
(deet) break *0x400bb1
Set breakpoint 1 at 0x400bb1
(deet) r
Child stopped (signal SIGTRAP)
Stopped at /deet/samples/segfault.c:15
(deet) break *0x400b8c
Set breakpoint 2 at 0x400b8c
(deet) cont
Child stopped (signal SIGTRAP)
Stopped at /deet/samples/segfault.c:10
(deet) cont
Calling func2
About to segfault... a=2
Child stopped (signal SIGTRAP)
Stopped at /deet/samples/segfault.c:5
(deet) cont
Child stopped (signal SIGSEGV)
Stopped at /deet/samples/segfault.c:5
(deet)
Milestone 7: Setting breakpoints on symbols
As a finishing touch, modify your implementation of Debugger to allow setting
breakpoints on line numbers and functions in addition to raw addresses.
If the specified breakpoint target starts with *, set a breakpoint on a raw
address as you did in the previous two milestones. If the target parses as a
u64 without error, treat it as a line number. Finally, if a function exists
whose name matches the specified target, set a breakpoint at that function. You
should print an error message if none of these cases succeed.
You can use DwarfData::get_addr_for_line and
DwarfData::get_addr_for_function to translate a line number or function name
into an address. (You can pass None as the first argument to each function,
unless you feel like supporting GDB’s syntax that allows for setting a
breakpoint on a line in a specific file.) Then, you can simply use your code
from the previous milestones to set a breakpoint at an address.
Once you have this working, you may also want to delete the
debug_data.print() from Debugger::new which you added in Milestone 5. This
isn’t necessary anymore.
🍌 cargo run samples/segfault
   Compiling deet v0.1.0 (/deet)
    Finished dev [unoptimized + debuginfo] target(s) in 26.91s
     Running `target/debug/deet samples/segfault`
(deet) break 15
Set breakpoint 0 at 0x400bf1
(deet) break func1
Set breakpoint 1 at 0x400bad
(deet) break func2
Set breakpoint 2 at 0x400b71
(deet) r
Child stopped (signal SIGTRAP)
Stopped at /deet/samples/segfault.c:15
(deet) c
Child stopped (signal SIGTRAP)
Stopped at /deet/samples/segfault.c:9
(deet) c
Calling func2
Child stopped (signal SIGTRAP)
Stopped at /deet/samples/segfault.c:3
(deet) c
About to segfault... a=2
Child stopped (signal SIGSEGV)
Stopped at /deet/samples/segfault.c:5
(deet)
Voilà! You have a functional debugger ready to knock the socks off of any GDB user!
We hope you enjoyed the process of working through this and are proud of what you’ve built! It may not be the fanciest debugger in town, but you’ve implemented the foundation that all debuggers are built on. Hopefully this also gives you some respect for systems tooling – this was a lot of work, and there’s a lot going on here!
Optional extensions
Next line
To implement something like GDB’s “next” command, you can add a single-step
method to Inferior that steps forward by one instruction (being careful to
manage breakpoints properly). Then, you can call this method in a loop until
you end up on a different line, or until the inferior terminates.
Print source code on stop
Each time the inferior stops, in addition to showing a line number, GDB prints the line of source code that the inferior stopped on. This is extremely helpful when step debugging. It’s not too difficult to implement: since you know the file path and line number, you can read the file and print the appropriate text from it.
Print variables
You may have noticed that we populated DwarfData with a list of variables in
each function. Using this information, you can implement something like GDB’s
print command to inspect the contents of variables.