Week 3 Exercises: Error handling, I/O, and traits
Great job making it so far in the quarter! It has only been two weeks, but we’ve covered a lot of ground. We hope you are staying healthy and enjoying yourself this quarter.
Purpose
In the first part of these exercises, you’ll work through implementing a tool for inspecting file descriptors that you can use to debug your CS 110 assignments. This will give you more practice with structs and error handling.
The second part of the exercises will give you some experience with traits in Rust. Traits are most helpful in managing large codebases with many related types, and since we don’t have the time to introduce a substantial codebase, we won’t be having you design your own traits. However, these exercises will give you experience with implementing standard traits on your own data type.
By the end of this week, you will have learned what we consider to be the most
crucial parts of the Rust language. There is plenty more to learn, but what you
don’t know yet you can quickly pick up through Googling and reading
documentation. If you’re still feeling shaky about any of the concepts we’ve
talked about, that’s okay! You’ll internalize them as you write more code. As
always, you’re welcome to ask questions on the #rust-questions channel!
Due date: Wednesday, April 29, 11:59pm (Pacific time)
Ping us on Slack if you are having difficulty with this assignment. We would love to help clarify any misunderstandings, and we want you to sleep!
Getting the code
The starter code is available on GitHub here.
Part 1: Inspecting File Descriptors
In this part of the assignment, you will build a tool to inspect the open files of processes. This is based on a tool that was the precursor to C Playground’s open files debugger; although it is a bit complicated to use and does not show a full representation of the open file table (the kernel doesn’t expose much information to userspace, and we had to modify the kernel for C Playground), it is still very useful for debugging file descriptor issues in CS 110’s assignments 3 (multiprocessing pset) and 4 (Stanford shell).
To use the tool to debug a file-descriptor-related problem, you would do the following:
- Add a
sleep(30)call at the point in the program where you want to see the file descriptor table - Run the buggy program in one terminal window
- In a second terminal window,
sshinto the same myth machine (e.g.myth65.stanford.eduif that is where the first terminal window is logged in) and runinspect-fds <name or PID of your program>
inspect-fds then prints a representation of the file descriptor tables at
that point in time. For example, here is the output where a parent process
creates two pipes and forks, using the file descriptor 4 to write data to the
child process’s stdin and file descriptor 5 to read data from the child
process’s stdout:
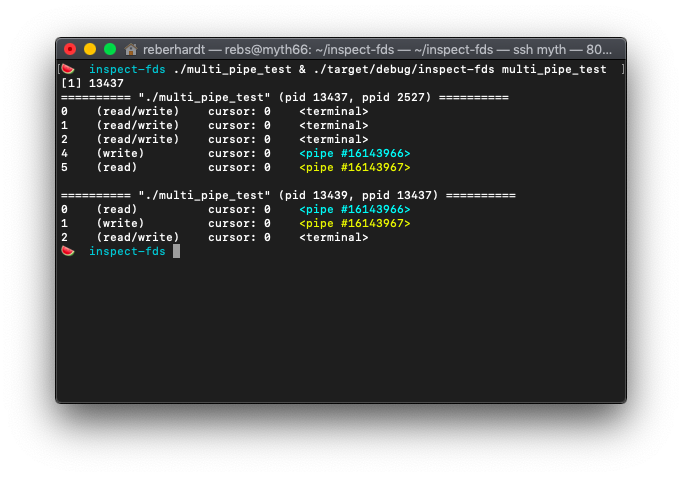
The pipes are color coded so that it is easier to identify file descriptors that point to the same pipe (in this example, parent fd 4 writes to the pipe that child fd 0 reads from, and parent fd 5 reads from the pipe that child fd 1 writes to).
This tool is especially helpful for debugging mistakes in CS 110 assignment
4, in which you implement a shell. Shells do pretty complicated rewiring of the
file descriptor table in order to create pipelines of processes of arbitrary
length, and in order to read/write input from/to files on disk. Here is what
the file descriptor tables should look like when the assignment 4 shell runs
sleep 100 < /tmp/testinput | sort | wc > /tmp/testoutput. (This is a useless
command, but we put sleep 100 there in order to keep the pipeline running
while we go to run inspect-fds in the other terminal.)
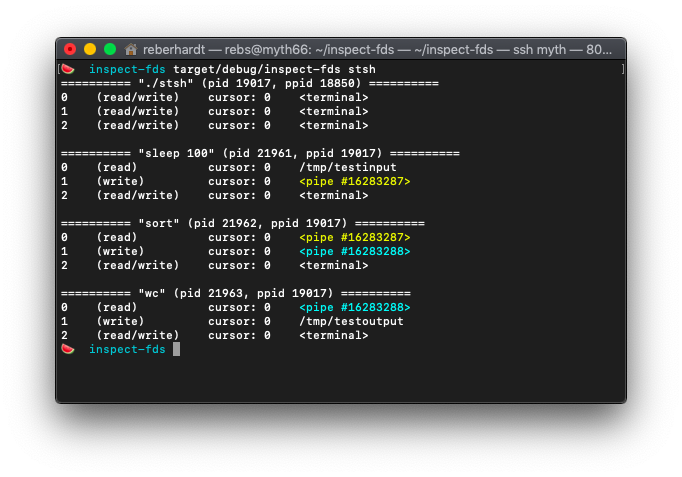
Here, you can see sleep 100 is getting its input from /tmp/testinput and is
writing output to a pipe, which is connected to stdin for sort, whose output
goes to a second pipe, connected to stdin for wc, whose final output is
written to /tmp/testoutput.
Implementing this tool involves a lot of file I/O, which will give you excellent practice with error handling. I think I/O is probably the absolute worst when it comes to error handling, so if you can put up with this, you can put up with anything. This exercise will also give you good practice working with structs. We hope that throughout the process, you have fun with it, learn a bit about how Linux works, and build yourself a tool that you can use in CS 110 in a week!
Word of warning
First, before you start working through the milestones below, you should run
make in the inspect-fds directory. This will build some tiny C programs
that you can use for testing.
Second, unfortunately, you need to run this tool on a Linux computer, because
Mac and Windows don’t use the same API for providing information about
processes. If you aren’t running Linux, you should do development on myth. If
you’re using an editor like Sublime or VSCode, you might want to check to see
if there is an SSHFS plugin available to simplify this. In the worst case
scenario, you can run your editor locally, then sync to myth and run cargo
in one command:
rsync -avxh --exclude target inspect-fds myth: && ssh -t myth "cd inspect-fds && cargo run"
In order for this to not be a pain in the butt, you’ll want to have set up an SSH config.
If you are working on myth, you may commonly see these errors:
warning: Hard linking files in the incremental compilation cache failed. Copying files instead.
You can ignore these errors. They indicate that the AFS filesystem doesn’t
support a feature that cargo uses for optimization, but it shouldn’t be a
problem for us.
Milestone 1: Getting the target process
A user specifies the process to inspect using a command line argument. For
example, if you are running bash, you can inspect it like so:
cargo run bash
Our first order of business is to get information about the process the user wants to inspect.
Open src/ps_utils.rs and quicky skim the code that is provided to you. We
have written some functions to call ps and pgrep to get information about
processes by PID or by command name. There is a lot of semi-complicated error
handling in this file (as there often is when dealing with I/O), so it may be
helpful to read as an example. You won’t need to modify anything in this file
for this assignment, but you will need to call get_target.
Next, open src/main.rs. You’ll see that we have declared a target variable
containing the first argument in argv. Use the ps_utils::get_target
function from the previous file to search for the target process.
- You’re welcome to use
expect()to handle the case whereget_targetreturns anErr: just provide some error message about there being a problem callingpsorpgrep. - If
get_targetreturnsNone, you should print an error message about there not being any matching process and callstd::process::exit(1). - Otherwise, print out the found process’s PID.
Here is our output (which you are not required to match):
🍉  cargo run bash
    Finished dev [unoptimized + debuginfo] target(s) in 0.58s
     Running `target/debug/inspect-fds bash`
Found pid 18042
🍉  cargo run nonexistent
    Finished dev [unoptimized + debuginfo] target(s) in 0.72s
     Running `target/debug/inspect-fds nonexistent`
Target "nonexistent" did not match any running PIDs or executables
As a convenience, we have also provided tests that run your program, checking
the exit code. (They don’t verify that your program prints anything in
particular!) You can run cargo test exit_status -- --nocapture --test-threads=1:
🍉  cargo test exit_status -- --nocapture --test-threads=1
    Finished dev [unoptimized + debuginfo] target(s) in 0.53s
     Running target/debug/deps/inspect_fds-41ab7dbb115eafda

running 2 tests
test test::test_exit_status_invalid_target ... Target "./nonexistent" did not match any running PIDs or executables
ok
test test::test_exit_status_valid_target ... Found pid 18306
ok

test result: ok. 2 passed; 0 failed; 0 ignored; 0 measured; 3 filtered out
Milestone 2: Printing process info
Let’s start printing out some more information about these processes. First, in
src/process.rs, let’s add a print() method to the Process struct. This
function will print details about this process. For now, print out the command
name, pid, and ppid in a format that is something like this:
========== "bash" (pid 18042, ppid 17996) ==========
You are welcome to format your output however you like.
Note: You could implement this functionality as part of the Display trait for
Process. However, the Display trait is typically supposed to generate a
compact, general-purpose representation of a value that can be used anywhere in
a codebase. Since this is generating detailed output for a high-level purpose
of this program, we put our implementation in an ordinary print() method on
Process.
Once you have implemented this method, go back to main and call your method
on the Process object that you got in the previous milestone. Run your
program (or use the cargo test command from the previous milestone) to ensure
it is printing as you expect.
Milestone 3: Listing file descriptors
Let’s get into the meat of this program! The Linux operating system exposes
some information from the kernel through the /proc filesystem. Files and
directories under /proc do not actually exist on disk; instead, they are
generated by the kernel on demand whenever you read them. You can see a
“directory” for each pid in /proc, and you can list each process’s file
descriptors by examining the directory /proc/{pid}/fd. For example,
inspecting zsh's file descriptors (you would see a different result if you
are running bash):
🍉  ls /proc/$$/fd     # $$ is a shell variable containing the shell's pid
0  1  10  11  12  14  2
In this milestone, we will implement Process::list_fds, which lists the
contents of /proc/{pid}/fd to get the file descriptor numbers that the
process has open.
Open src/process.rs and have a look at the list_fds method. This function
will return a list of file descriptor numbers (Vec<usize>) if the file
descriptor table is available; otherwise, it will return None. It is
important to handle the case of missing file descriptor tables for the purposes
of handling zombie processes, which are processes that have exited but have
not yet been reaped by their parents (i.e. their parents have not yet called
waitpid on them). The processes still exist in the process table, but most of
their resources have been freed, including the file descriptor table.
To implement this function, you should use fs::read_dir(path) to open the
directory. Then, iterate over the directory entries, parse the file names as
usize, and build a vector of file descriptor numbers. Here are some helpful
hints:
- The
format!macro will be useful for constructing the target path.format!is invoked exactly likeprintln!, but instead of printing a formatted string, it returns it. - Your function should not panic. That means you shouldn’t call
unwrap()orexpect()anywhere. Errors are anticipated in this function, and if they occur, you should returnNone. - When doing file I/O, you will encounter many functions that return a
Result. If you encounter anErr, you should simply returnNone, as this indicates the file descriptor table is unavailable. Here is a nice syntactical shortcut to make this slightly more pleasant:let some_var = something_that_returns_result().ok()?;The
Result::ok()function converts aResultto anOption, returningSome(val)if theResultwasOk(val), orNoneif theResultwasErr(some_error). Then, the?operator unwraps theOption, making your function returnNoneif theOptionwasNone. - The first example for
fs::read_dirmay be helpful for seeing how to read a directory. Note that their function returnsResultand ours returnsOption, so you will need to adopt the usage of?as explained in the previous bullet point.
When you have implemented this function, modify your print() function to call
list_fds(), loop over each file descriptor, and print each one. Try running
your program, and make sure it produces the output you expect. You can also run
the provided tests:
cargo test list_fds
Milestone 4: Printing additional open file information
Let’s take a closer look at /proc/{pid}/fd:
🍉  ls -l /proc/$$/fd
total 0
lrwx------ 1 rebs operator 64 Apr 22 15:13 0 -> /dev/pts/38
lrwx------ 1 rebs operator 64 Apr 22 15:13 1 -> /dev/pts/38
lrwx------ 1 rebs operator 64 Apr 22 15:13 10 -> /dev/pts/38
lr-x------ 1 rebs operator 64 Apr 22 15:13 11 -> /dev/urandom
lrwx------ 1 rebs operator 64 Apr 22 15:13 12 -> socket:[17099833]
lr-x------ 1 rebs operator 64 Apr 22 15:13 14 -> /usr/share/zsh/functions/Completion.zwc
lrwx------ 1 rebs operator 64 Apr 22 15:13 2 -> /dev/pts/38
Each file in this directory is a symbolic link pointing to whatever file the
file descriptor points to in the vnode table. Here, you can see that file
descriptors 0, 1, and 2 point to /dev/pts/38, which is the file that is
mapped to the terminal I currently have open.
We can get additional information about each file descriptor from
/proc/{pid}/fdinfo/{fd}:
🍉  cat /proc/$$/fdinfo/0
pos:	0
flags:	0100002
mnt_id:	22
This tells us the cursor, as well as flags set on the open file table entry
(which includes flags like O_RDONLY, O_WRONLY, O_WRONLY).
Open src/open_file.rs and skim the code that is in this file. In this
milestone, you will need to implement OpenFile::from_fd:
- First, use
fs::read_linkto read the destination path that the/proc/{pid}/fd/{fd}symbolic link points to. Similar to the previous milestone, you’ll want to use.ok()?to returnNoneif the file can’t be read (presumably because the file descriptor table is no longer available – the process may have just exited). Pass the path (as a string – seePathBuf::to_str()) toOpenFile::path_to_nameto get a human-friendly name for the file. - Use
fs::read_to_stringto read the contents of/proc/{pid}/fdinfo/{fd}. (Be careful not to read/proc/{pid}/**fd**/{fd}! You should callread_linkonfd/to see where the symbolic link points to, but if you callread_to_stringonfd/, it will follow the symbolic link and try reading the file that the fd points to. When it tries to read/proc/{pid}/fd/0, that is going to attempt to read from/dev/pts/38, which is the terminal file, effectively trying to read from stdin, which will cause your program to hang. By contrast,/proc/{pid}/fdinfo/0is a regular file that you can read to get information about fd 0.)- Pass this to
OpenFile::parse_cursorto extract the cursor from the file. - Pass this to
OpenFile::parse_access_modeto extract the mode from the file.
- Pass this to
- Return a new
OpenFilestruct with the name, cursor, and access mode you extracted.
You can use the supplied tests to check your work:
cargo test openfile_from_fd
Once you have implemented this function, open process.rs again and go to your
Process::print function. Instead of iterating over self.list_fds(), use
self.list_open_files() to get the file descriptors along with the
corresponding OpenFiles. You can use the following code to print file
descriptors, although you are welcome to write your own if you like:
match self.list_open_files() {
    None => println!(
        "Warning: could not inspect file descriptors for this process! \
            It might have exited just as we were about to look at its fd table, \
            or it might have exited a while ago and is waiting for the parent \
            to reap it."
    ),
    Some(open_files) => {
        for (fd, file) in open_files {
            println!(
                "{:<4} {:<15} cursor: {:<4} {}",
                fd,
                format!("({})", file.access_mode),
                file.cursor,
                file.colorized_name(),
            );
        }
    }
}
When this is done, your inspect-fds should be looking pretty good! Try it out:
🍉  cargo run bash
    Finished dev [unoptimized + debuginfo] target(s) in 1.16s
     Running `target/debug/inspect-fds bash`
========== "bash" (pid 19018, ppid 18803) ==========
0    (read/write)    cursor: 0    <terminal>
1    (read/write)    cursor: 0    <terminal>
2    (read/write)    cursor: 0    <terminal>
3    (read)          cursor: 0    /dev/urandom
4    (read/write)    cursor: 0    socket:[16103476]
255  (read/write)    cursor: 0    <terminal>

🍉  ./zombie_test & cargo run zombie_test
[1] 20630
    Finished dev [unoptimized + debuginfo] target(s) in 1.09s
     Running `target/debug/inspect-fds zombie_test`
========== "./zombie_test" (pid 20630, ppid 18509) ==========
0    (read/write)    cursor: 0    <terminal>
1    (read/write)    cursor: 0    <terminal>
2    (read/write)    cursor: 0    <terminal>
4    (write)         cursor: 0    <pipe #16102316>

========== "[zombie_test] <defunct>" (pid 20632, ppid 20630) ==========
Warning: could not inspect file descriptors for this process! It might have exited just as we were about to look at its fd table, or it might have exited a while ago and is waiting for the parent to reap it.
Milestone 5: Inspecting child processes
For this tool to be most useful in debugging file descriptor issues (such as how pipes are wired up), we don’t want to only show information about one process; we should also show information about other related processes. For our purposes, let’s print the user-specified process along with all its child processes.
This involves a simple modification to your code in main.rs. After printing
information about the user-specified process, call
ps_utils::get_child_processes to get a list of child processes (again, it’s
acceptable to call expect() here). Iterate over these processes, and call
your print function on each of them.
Your output should look something like this:
🍉  ./multi_pipe_test & cargo run multi_pipe_test
[1] 4060
    Finished dev [unoptimized + debuginfo] target(s) in 1.04s
     Running `target/debug/inspect-fds multi_pipe_test`
========== "./multi_pipe_test" (pid 4060, ppid 18509) ==========
0    (read/write)    cursor: 0    <terminal>
1    (read/write)    cursor: 0    <terminal>
2    (read/write)    cursor: 0    <terminal>
4    (write)         cursor: 0    <pipe #16301201>
5    (read)          cursor: 0    <pipe #16301202>

========== "./multi_pipe_test" (pid 4062, ppid 4060) ==========
0    (read)          cursor: 0    <pipe #16301201>
1    (write)         cursor: 0    <pipe #16301202>
2    (read/write)    cursor: 0    <terminal>
That’s it! You’re done! You’ll be able to use this tool to debug your CS 110 assignment 3 and assignment 4 code.
Part 2: A Generic LinkedList
Let’s get some practice with generics and traits! In this portion of the
exercises, we will take the LinkedList lecture example from last Thursday and
extend its implementation to make it more useful as a data structure.
You will find Thursday’s code in src/linked_list.rs. You are invited to add
code to src/main.rs to test your changes.
Make LinkedList generic
Our LinkedList implementation from last Thursday only stores u32 values.
Your first task is to modify LinkedList to support generic types, storing
values of any type T. When you have done this, modify src/main.rs and try
creating a list of Strings!
Note: this may require you to modify the impl fmt::Display to incorporate a
trait bound! You’ll need to consider whether it makes sense to implement
Display on LinkedList for all generic types. You should refer to
Tuesday’s lecture material for a discussion on trait bounds.
Implementing traits
There are four traits below that you may implement. Of them, you only need to
implement two. The first three are the most straightforward, but if you have
extra time and are feeling adventurous, try implementing IntoIter!
Clone
The Clone
trait adds a clone() method to objects that creates a deep copy of the
object. Your implementation should synthesize a freshly-allocated linked list
copied from the original one. Similar to Display, you’ll need to think about
the trait bounds you want to impose on T.
Hint: Note that Box
PartialEq
The PartialEq
trait makes it possible to compare values using the == operator. Two linked
lists should be considered equal to one another if they are of the same length
and corresponding nodes are equal. Again, you need to impose appropriate trait
bounds here.
ComputeNorm
Implement the ComputeNorm trait from lecture for LinkedList<f64>. If you
implement Iterator/IntoIterator (below), you should use that to implement
ComputeNorm!
Iterator and IntoIterator
The IntoIterator
trait allows you to iterate over a type using a for loop. Try implementing
IntoIter for LinkedList<T> (i.e. an iterator that takes ownership of the
list it is iterating over) and &LinkedList<T> (i.e. an iterator that only
references elements in the list).
This article provides a great
overview of what is going on and what is necessary to implement. I also highly
recommend looking at Will Crichton’s wonderful notes on
traits under the
“Associated Types” section for an example of how to implement the iterator
trait. Note that he doesn’t define his own struct and instead implements the
trait on &List<T>. For your own implementation, you should implement your own
struct that keeps track of the current node pointer and make that struct public
i.e. with pub struct LinkedListIterator.
For &LinkedList<T>, implement the trait only on types T that implement
Clone, so that the next function returns copies of the elements in your
list. There is a way to implement this in a way that doesn’t require cloning
and we could also implement IntoIterator for &mut T – this would, however,
lead to a more complex implementation. Feel free to try it though if you’d like
an extra challenge!
Note that, in order to implement IntoIterator for LinkedList<T> (as in, an
iterator that will take ownership of the LinkedList<T> it is iterating over),
you can simply implement the Iterator trait for LinkedList<T>. Our implementation
of next is only one line long since it makes a call to an already implemented
function! (hint hint)
Implementing IntoIterator for &LinkedList<T> is a little more complicated, so
we’ve scaffolded it for you. Here’s what the implementation would look like for
the original LinkedList that would only handle u32s:
pub struct LinkedListIter<'a> {
    current: &'a Option<Box<Node>>,
}


impl Iterator for LinkedListIter<'_> {
    type Item = u32;
    fn next(&mut self) -> Option<u32> {
        match self.current {
            Some(node) => {
                // YOU FILL THIS IN!
            },
            None => // YOU FILL THIS IN!
        }
    }
}

impl<'a> IntoIterator for &'a LinkedList {
    type Item = u32;
    type IntoIter = LinkedListIter<'a>;
    fn into_iter(self) -> LinkedListIter<'a> {
        LinkedListIter {current: &self.head}
    }
}
Here the 'a syntax is labeling a lifetime. Let’s zero in on the struct definition:
pub struct LinkedListIter<'a> {
    current: &'a Option<Box<Node>>,
}
This syntax essentially says that the struct lives as long as the reference it
contains, so that we don’t have issues with dangling pointers. In the code that
you fill in, you won’t have to deal with 'a explicity. However, in order to
make this generic, everywhere you see a <'a>, you will have to replace it with
a <'a, T>.
You can read more about lifetimes here.
Part 3: Weekly survey
Please let us know how you’re doing using this survey.
When you have submitted the survey, you should see a password. Put this code in
survey.txt before submitting.
Submitting your work
As with last week, you can commit your progress using git:
git commit -am "Type some title here to identify this snapshot!"
In order to submit your work, commit it, then run git push. This will upload
your commits (snapshots) to Github, where we can access them. You can verify
that your code is submitted by visiting
https://github.com/cs110l/week3-yourSunetid and browsing the code there. You
can git push as many times as you’d like.
Grading
Part 1 (inspect-fds) will be worth 50% (with each milestone being worth 10%),
Part 2 (linked list) will be worth 30%, and Part 3 (survey) will be worth 20%.
You’ll earn the full credit for each piece if we can see that you’ve made a
good-faith effort to complete it.