Let's Build a High-Performance Fuzzer with GPUs!
TL;DR: Can we use GPUs to get 10x performance/dollar when fuzzing embedded software in the cloud? Based on our preliminary work, we think the answer is yes!
Fuzzing is a software testing technique that supplies programs with many randomized inputs in an attempt to cause unexpected behavior. It’s an important, industry-standard technique responsible for the discovery of many security vulnerabilities and the prevention of many more. However, fuzzing well takes time, and fuzzing embedded software presents additional challenges.
Embedded platforms are not designed for the instrumentation and high-throughput computation required to find bugs via fuzzing. Without access to source code, practical fuzzing of such platforms requires an emulator, which is slow, or many physical devices, which are often impractical.
Most fuzzing approaches have used conventional CPU architectures or emulators, but we decided to use other commodity hardware to tackle this problem—in particular, GPUs. The recent boom in machine learning has driven down the off-peak price of GPUs and made massive GPU computing capacity readily available from all major cloud providers. GPUs are very good at executing tasks in parallel, and fuzzing is an easily parallelizable problem.
In this blog post, I’ll walk you through the design and implementation of this massively parallel GPU-based fuzzer. So far, we’ve implemented an execution engine that can achieve 5x more executions/second/dollar than libFuzzer—and there’s much more room for optimization.
This article was cross-posted to the Trail of Bits blog here. Brandon Falk also wrote an excellent response critiquing our work, and I highly recommend giving that a read as well.
The Pitch: Fuzzing with GPUs
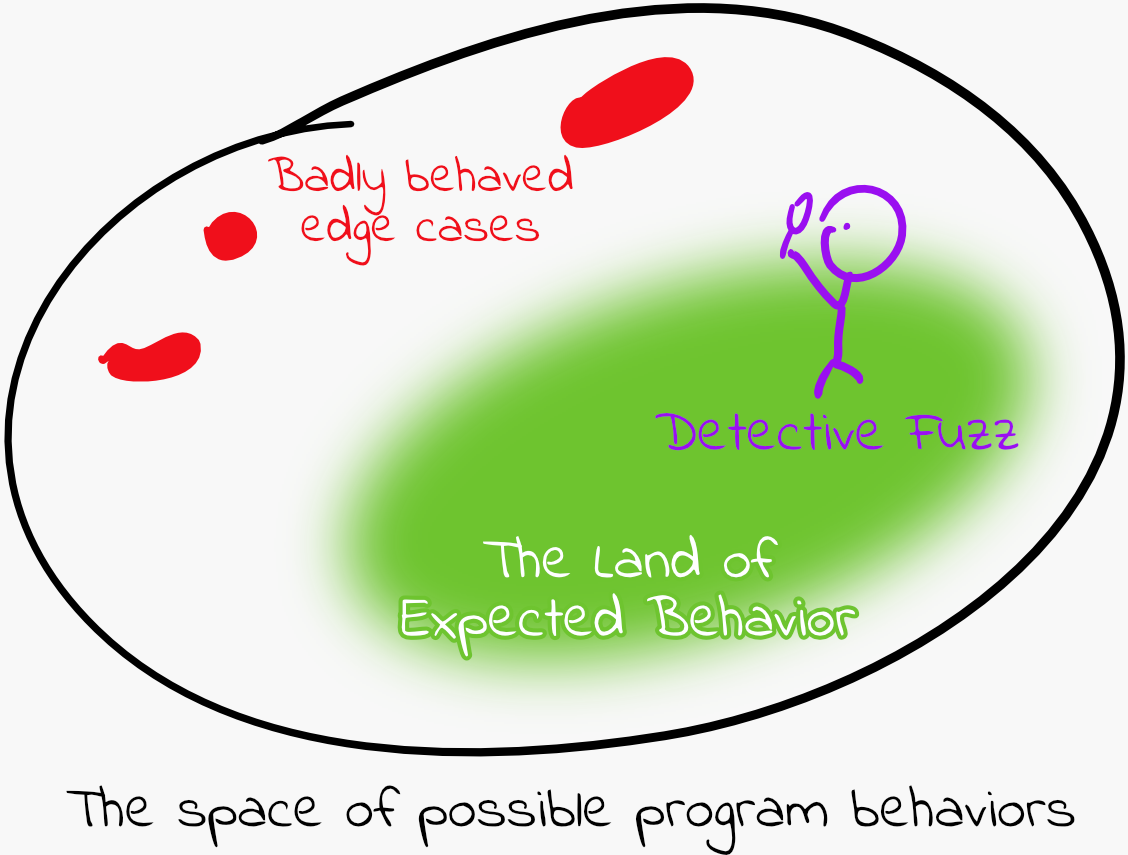
Fuzzing aims to generate unexpected inputs to a program and cause undesired behaviors (e.g., crashes or memory errors). The most commonly used fuzzers are coverage-guided fuzzers, which focus on finding inputs that cause new code coverage (such as executing a function that wasn’t executed before) to explore edge cases that may crash the program.
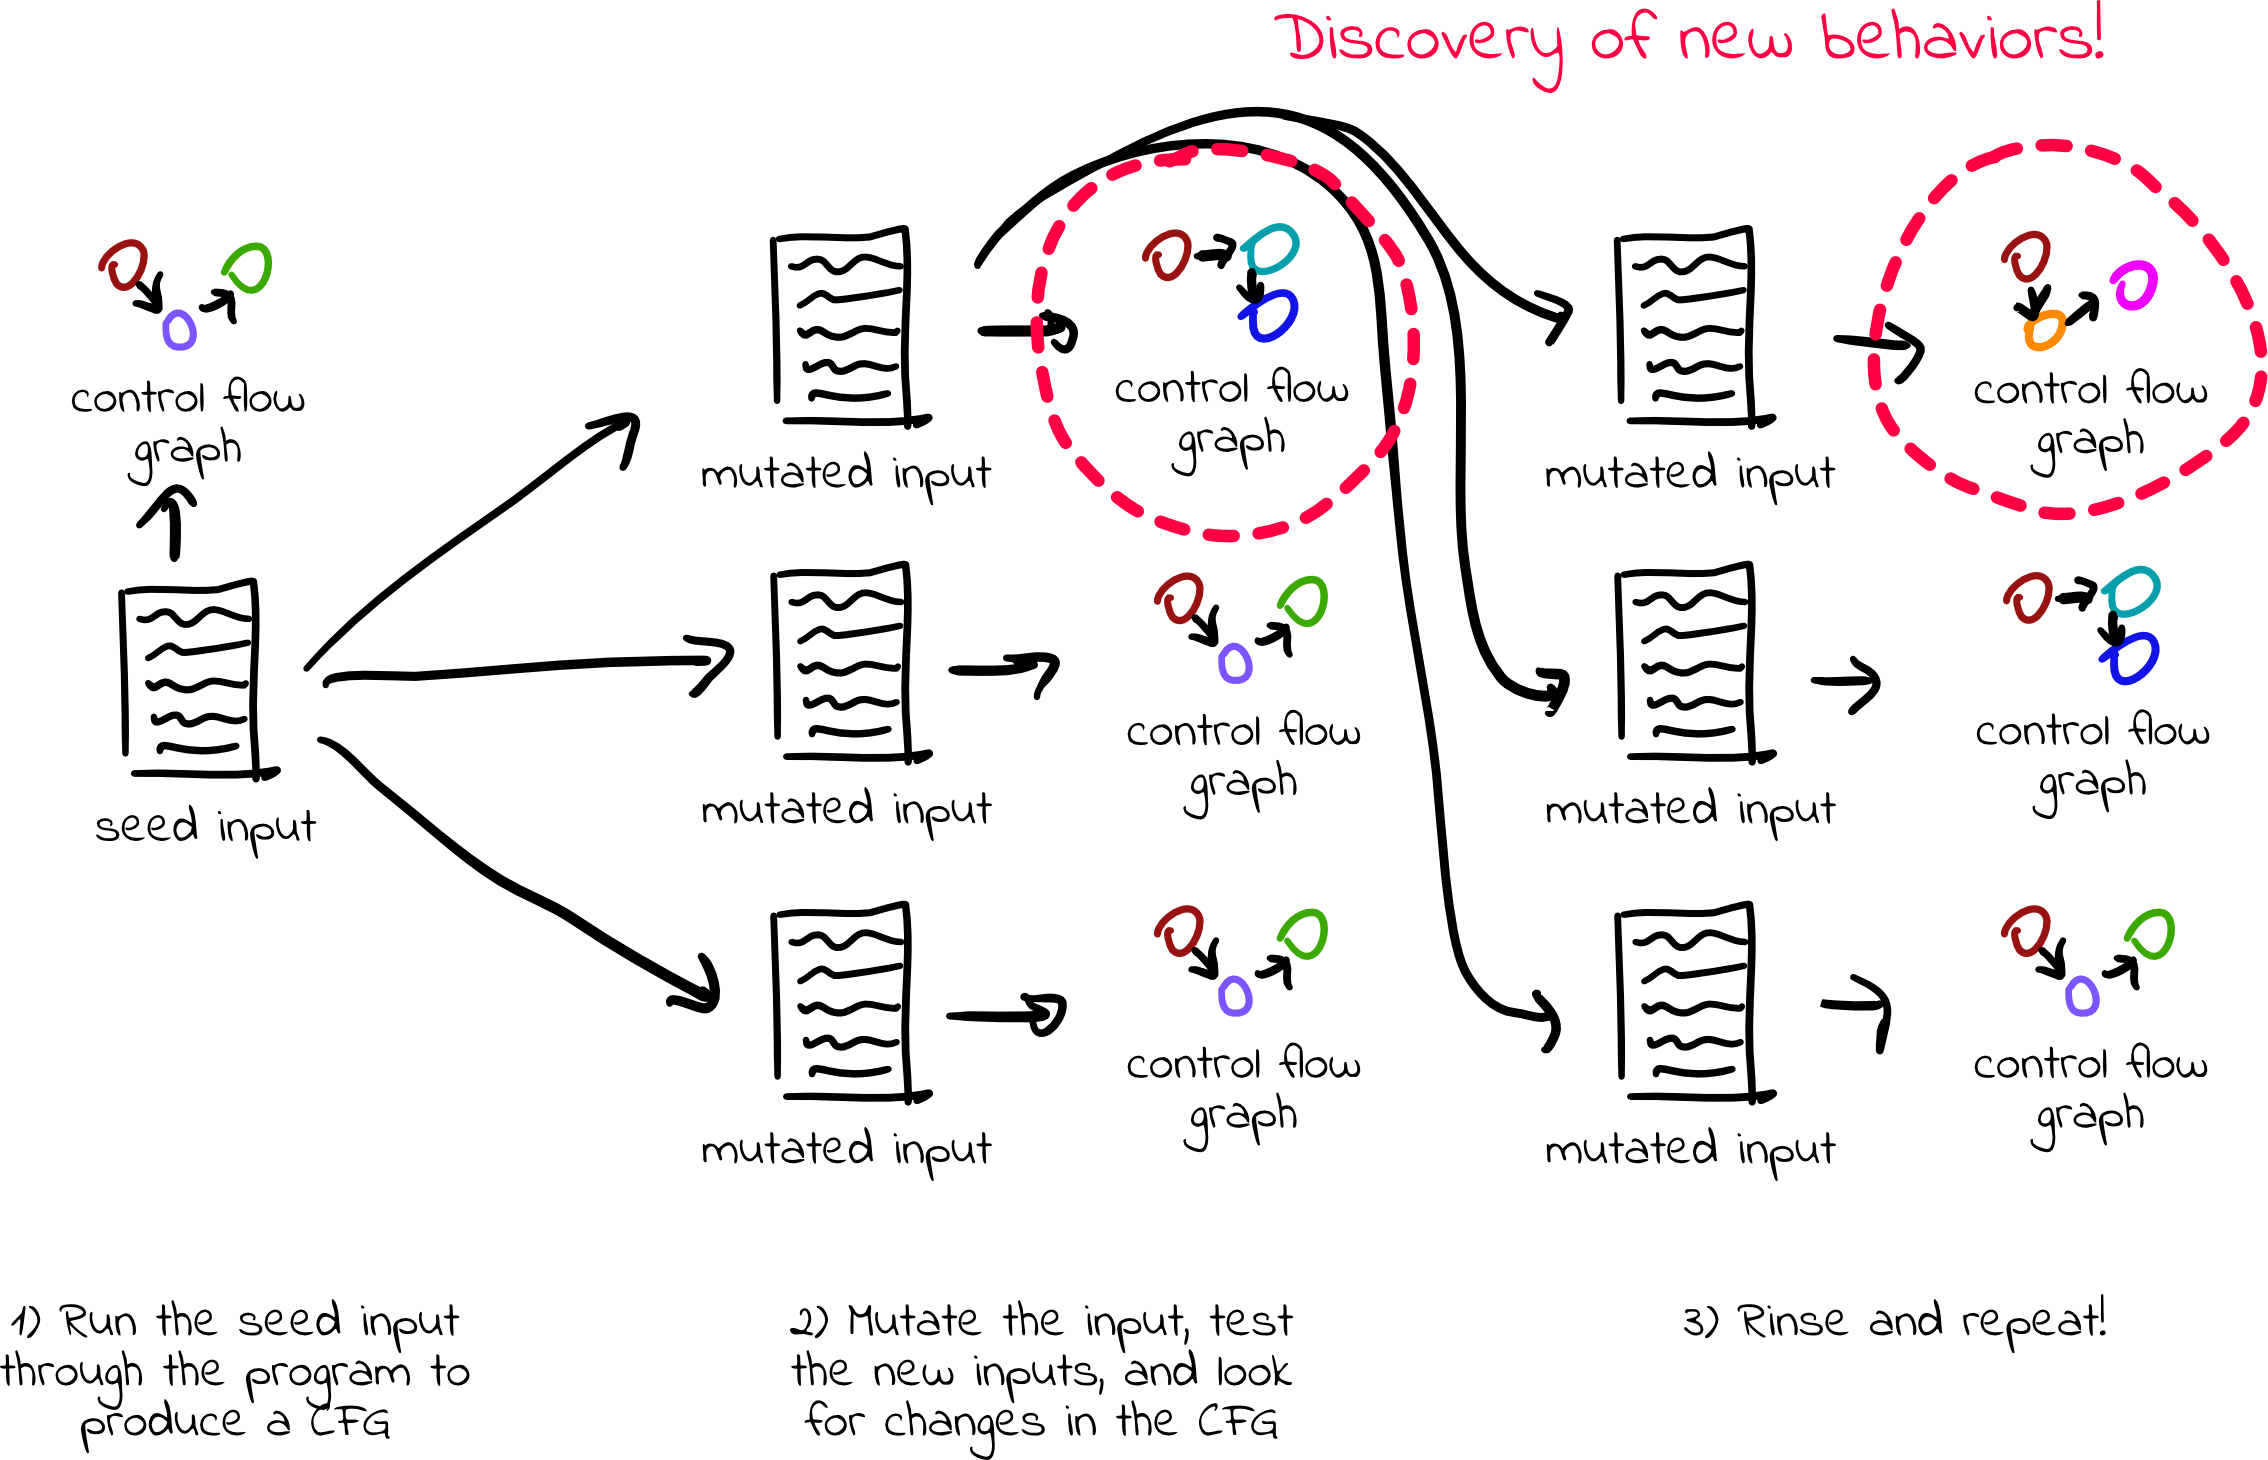
To do this, fuzzers run many different randomized inputs through the target program. This task is easily parallelizable, as each input can be executed independently of the others.
GPUs are fairly cheap; it costs $0.11/hour for a pre-emptible Tesla T4 on Google Cloud. Also, GPUs are really good at executing many things in parallel—a Tesla T4 can context-switch between over 40,000 threads and can simultaneously execute 2,560 of them in parallel—and, as mentioned, fuzzing is a naturally parallelizable problem. Using thousands of threads, we should theoretically be able to test thousands of different inputs at the same time.
Why Hasn’t Anyone Done This Before?
In short, running code on GPUs is very different from running code on CPUs in a few critical ways.
First, a GPU cannot directly execute x86/aarch64/etc. instructions, as GPUs have their own instruction set. Our goal is to fuzz embedded software for which no source code is available. With only a binary in hand, we have no easy way of generating GPU assembly to run.
Second, a GPU has no operating system. Traditional parallel fuzzers launch multiple processes that can execute inputs separately without interfering with other processes. If an input causes one process to crash, other processes will be unaffected. GPUs have no notion of processes or address space isolation, and any memory violation will cause the entire fuzzer to crash, so we need to find some way to isolate the parallel instances of the program being fuzzed.
Additionally, without an operating system, there’s no one home to answer system calls, which enable a program to open files, use the network, and so on. System calls must be emulated or relayed back to the CPU to be executed by the host operating system.
Finally, GPU memory is hard to manage well. GPUs have complicated memory hierarchies with several different types of memory, and each has different ease-of-use and performance characteristics. Performance is highly dependent on memory access patterns, and controlling when and how threads access memory can make or break an application. Additionally, there isn’t much memory to go around, making it even more difficult to properly manage memory layout and access patterns. Having 16GB of device memory might sound impressive, but splitting it between 40,000 threads of execution leaves each thread with a paltry 419 KiB.
Can We Build It? Yes We Can!
There are many obstacles to building a working GPU fuzzer, but none of them are insurmountable.
Executing code with binary translation
First, let’s see if we can get aarch64 binaries running on the GPU.
As mentioned, we want to fuzz embedded binaries (e.g., ARMv7, aarch64, etc.) on the GPU. NVIDIA GPUs use a different instruction set architecture called PTX (“Parallel Thread eXecution”), so we cannot directly execute the binaries we want to fuzz. A common solution to this problem is to emulate an embedded CPU, but developing a CPU emulator for GPUs would likely be an expensive investment that would perform poorly. Another alternative is to translate binaries to PTX so they can execute directly on the GPU without emulation.
Trail of Bits has developed a binary translation tool called Remill that we can use to do this. Remill “lifts” binaries to LLVM IR (intermediate representation), which can then be retargeted and compiled to any architecture supported by the LLVM project. It just so happens that LLVM supports emitting LLVM IR as PTX code, which is perfect for our purposes.

Say we have this simple example function, which sets w19 to 0, adds 5, and returns the result:
main:
    mov w19, #0       // Store the number 0 in register w19
    add w19, w19, #5  // Add 5
    mov w0, w19       // Return the result
    ret
We can pass the bytes for these instructions to Remill, which produces LLVM IR that models the original program executing on an ARM processor:
// Simplified for brevity :)
define dso_local %struct.Memory* @_Z5sliceP6MemorymPm(%struct.Memory* readnone returned %0, i64 %1, i64* nocapture %2) local_unnamed_addr #0 {
  %4 = add i64 %1, 1
  store i64 %4, i64* %2, align 8, !tbaa !2
  ret %struct.Memory* %0
}
Then, with some optimizations, we can have LLVM compile the above LLVM IR to PTX assembly:
ld.param.u64  %rd1, [sub_0_param_0];
ld.param.u64  %rd2, [sub_0_param_1];
mov.u64       %rd4, 5;
st.u64        [%rd1+848], %rd4;
add.s64       %rd5, %rd2, 12;
st.u64        [%rd1+1056], %rd5;
ret;
Finally, we can load this PTX into a GPU and execute it as if we’d had access to the source code in the first place.
Managing Memory
As mentioned earlier, GPUs have no operating system to provide isolation between processes. We need to implement address space isolation so multiple instances of the fuzzed program can access the same set of memory addresses without interfering with each other, and we need to detect memory safety errors in the target program.
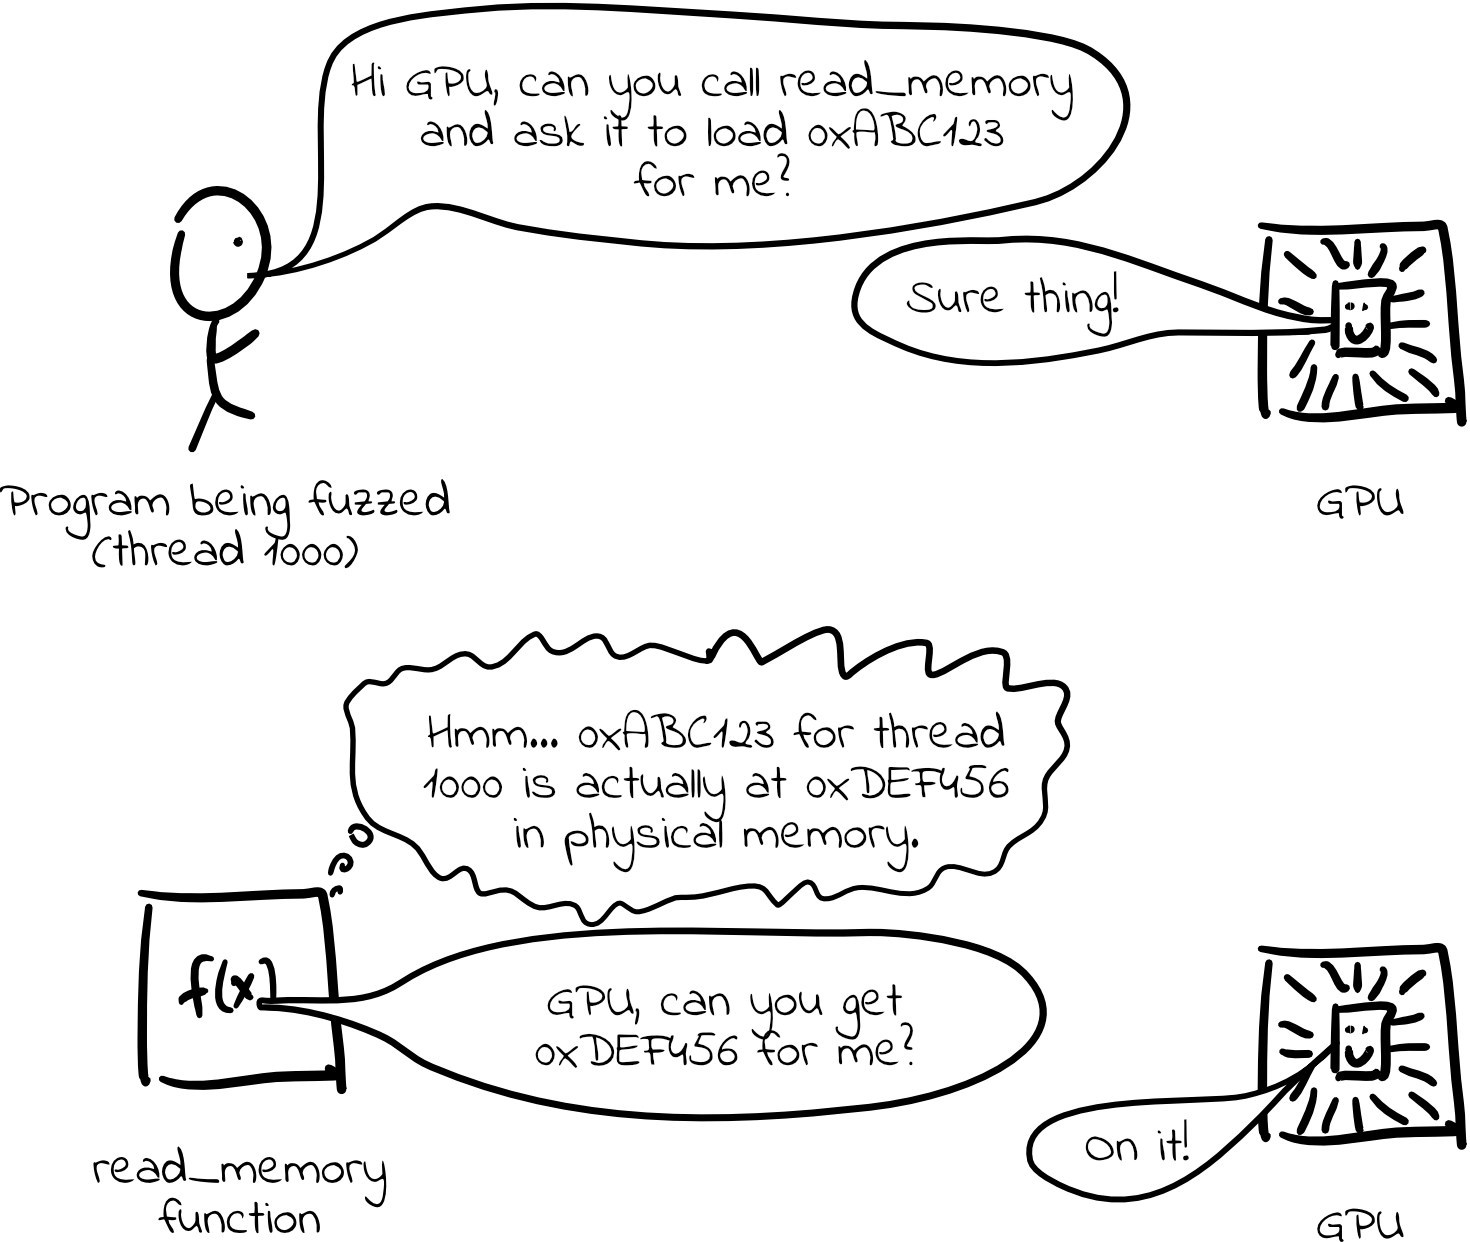
Remill replaces all memory access in the original program with calls to the special functions read_memory and write_memory. By providing these functions, we can implement a software memory management unit that fills in for the missing OS functionality and mediates memory accesses.
For example, consider this function that takes a pointer and increments the integer it points to:
add_one:
ldr w8, [x0]   // Load the value pointed to by the pointer
add w8, w8, #1 // Increment the value
str w8, [x0]   // Write the new value back
ret
Remill translates this assembly into the following IR containing a read_memory call, an add instruction, and a write_memory call:
define %struct.Memory* @slice(%struct.Memory*, i64 %X8, i64* nocapture %X0_output) local_unnamed_addr #2 {
%2 = tail call i32 @__remill_read_memory_32(%struct.Memory* %0, i64 undef) #3
%3 = add i32 %2, 1
%4 = tail call %struct.Memory* @__remill_write_memory_32(%struct.Memory* %0, i64 undef, i32 %3) #3
%5 = tail call %struct.Memory* @__remill_function_return(%struct.State* nonnull undef, i64 16, %struct.Memory* %4) #2, !noalias !0
ret %struct.Memory* %5
}
By providing __remill_read_memory_32 and __remill_write_memory_32 functions, we can give each thread its own virtual address space. In addition, we can validate memory access and intercept invalid access before it crashes the entire fuzzer.
Remember, though, that 16GB of device memory is actually not much when shared across 40,000 threads. To conserve memory, we can use copy-on-write strategies in our MMU; threads share the same memory until one of the threads writes to memory, at which point that memory is copied. Conserving memory this way has been a surprisingly effective strategy.
Initial performance
Wonderful—we have something that works! We can take a binary program, translate it to LLVM, convert it to PTX, mix in an MMU, and run the result on thousands of GPU threads in parallel.

But how well are we meeting our goal of building a fuzzer that achieves 10x performance per dollar when compared to other fuzzers?
Evaluating fuzzers is a very tricky business, and there have been many papers published about how to effectively compare them. Our fuzzer is still too young to properly evaluate, since we are still missing critical fuzzer components such as a mutator to generate new inputs to the program. To measure executor performance only, we can look at how quickly our fuzzer runs inputs through the target program (in executions/second). By normalizing the cost of the compute hardware (GPUs are more expensive than the CPUs on which other fuzzers run), we can compare executions/second/$.
What should we fuzz in our benchmarking tests? The BPF packet filtering code from libpcap seems like a good candidate for a few reasons:
- It implements a complicated state machine that is too difficult for humans to reason about, making it a good candidate for fuzzing.
- BPF components have had bugs in the past, so this is a realistic target that we might want to fuzz.
- It has no system calls (our minimal fuzzer does not yet support system calls).
Let’s write a test application that takes a packet from the fuzzer and runs a complicated BPF filter program on it:
dst host 1.2.3.4 or tcp or udp or ip or ip6 or arp or rarp
or atalk or aarp or decnet or iso or stp or ipx
This test program doesn’t do a whole lot, but it does exercise complicated logic and requires a good amount of memory access.
To evaluate our fuzzer, we can compare it to libFuzzer, a fast and widely used fuzzer. This isn’t an entirely fair comparison. On one hand, libFuzzer solves an easier problem: It fuzzes using the test program’s source code, whereas our fuzzer translates and instruments a binary compiled for a different architecture. Source code is often unavailable in security research. On the other hand, libFuzzer is performing mutation to generate new inputs, which we are not doing. While obviously imperfect, this comparison will work well enough to provide order-of-magnitude estimates.
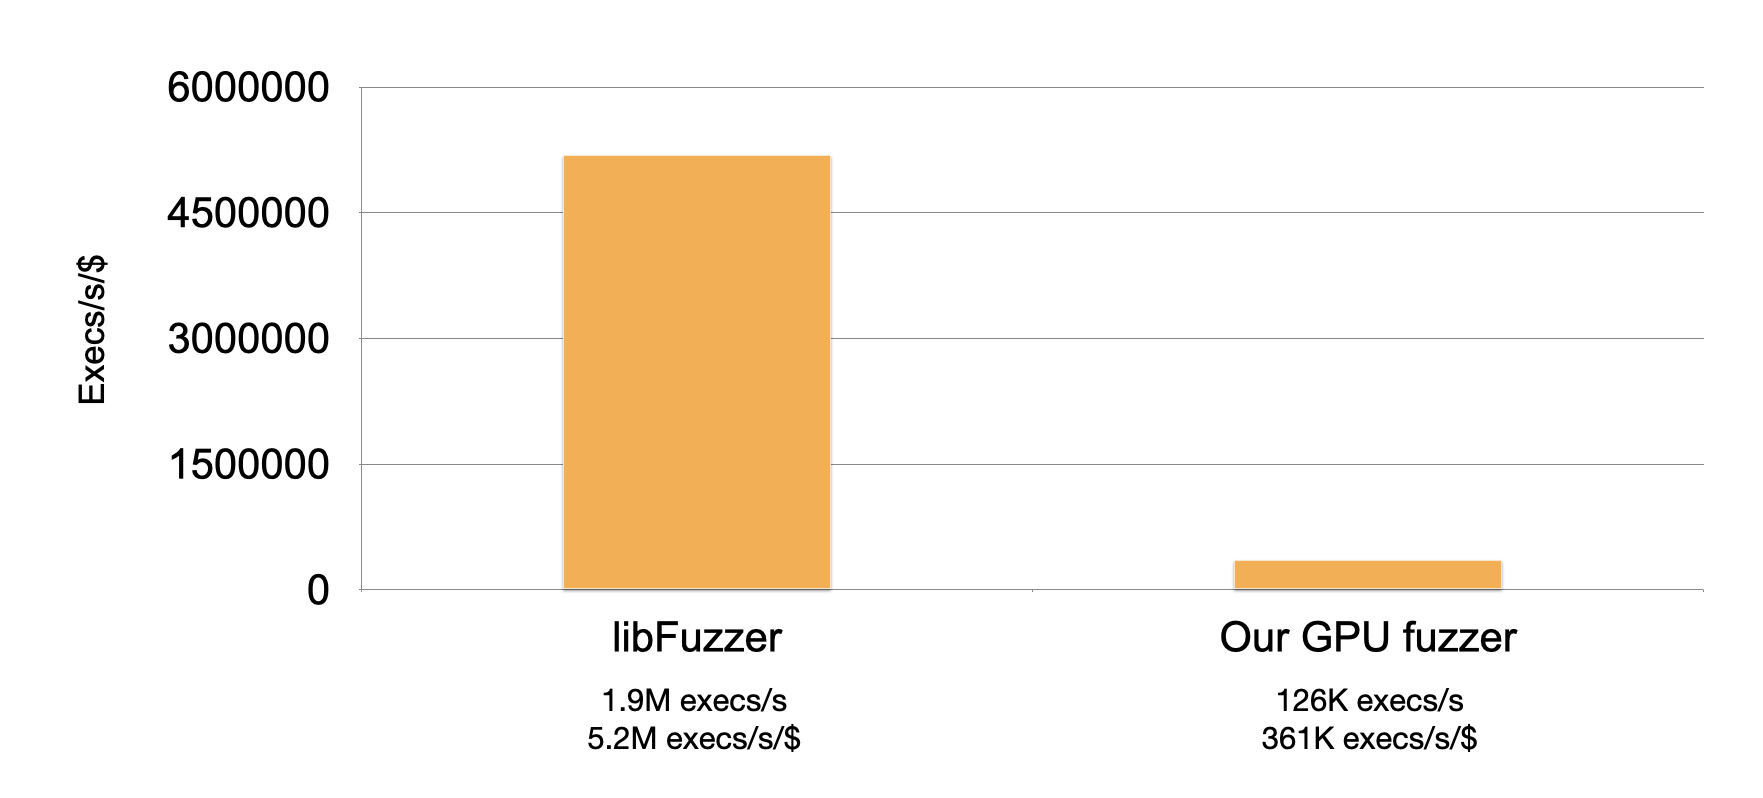
I ran this comparison using Google Compute Engine 8-core N1 instances ($0.379998/hour for non-preemptible instances at time of writing) and a Tesla T4 GPU ($0.35/hour at time of writing).
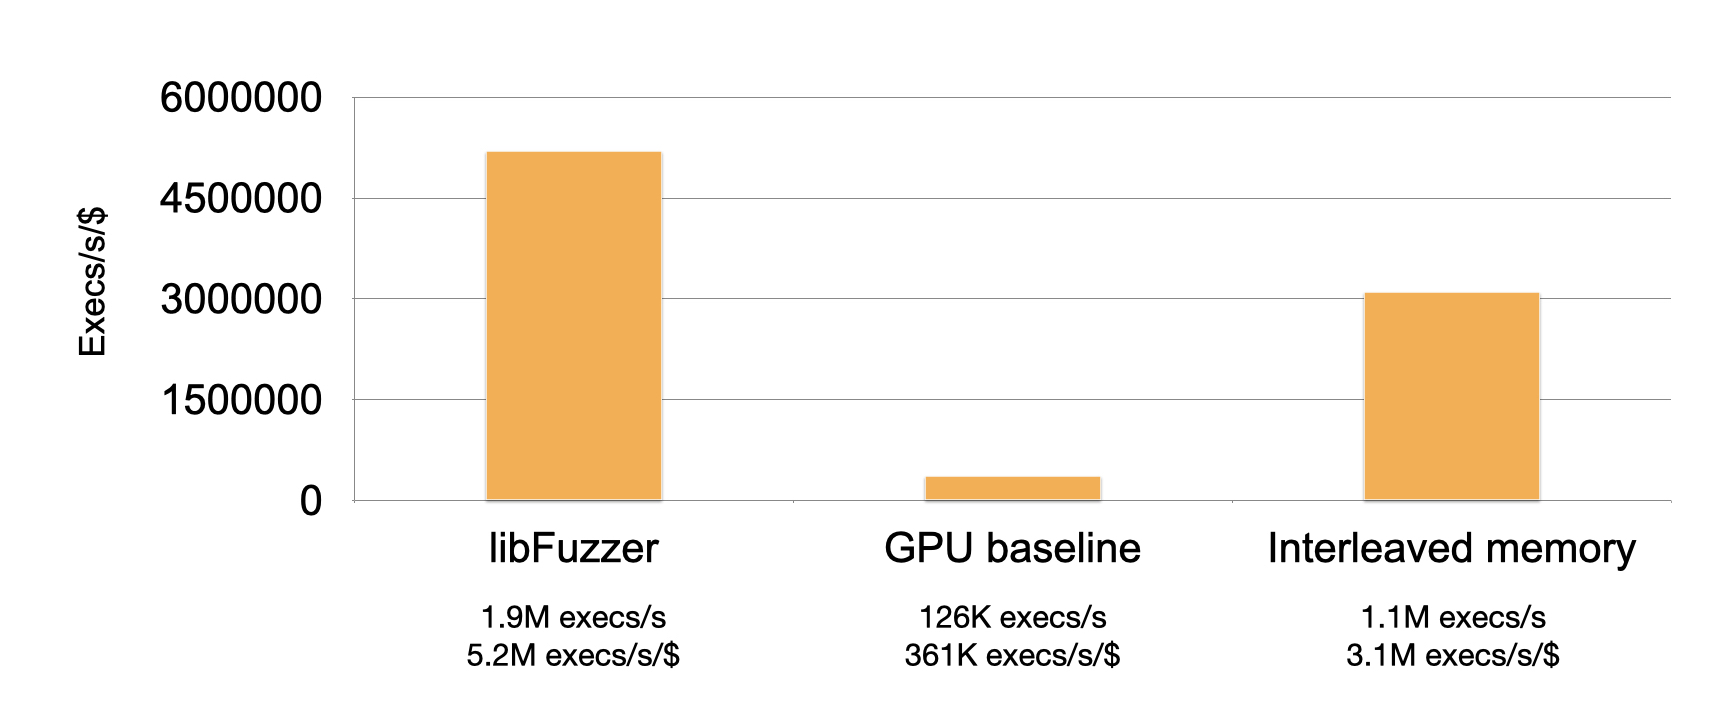
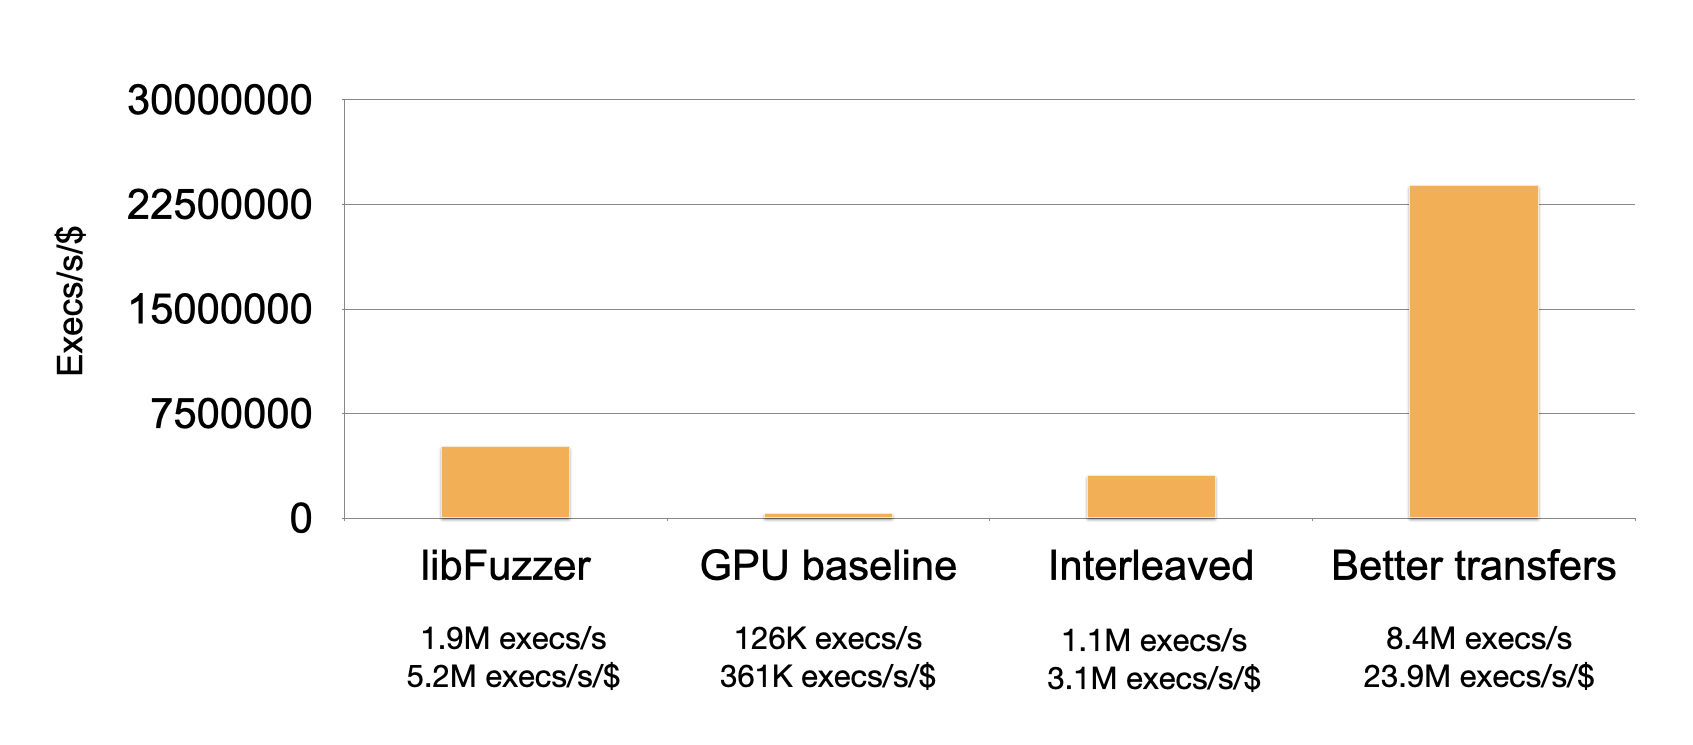
Unfortunately, our fuzzer doesn’t compare so well against libFuzzer. libFuzzer achieves 5.2M execs/s/$, and our fuzzer only achieves 361K execs/s/$.
Let’s see if we can do better…
Interleaving Memory
Before we start optimizing performance, we should profile the fuzzer to get a better sense of how it’s performing. Nvidia’s Nsight Compute profiler helps explain hardware utilization and performance bottlenecks.
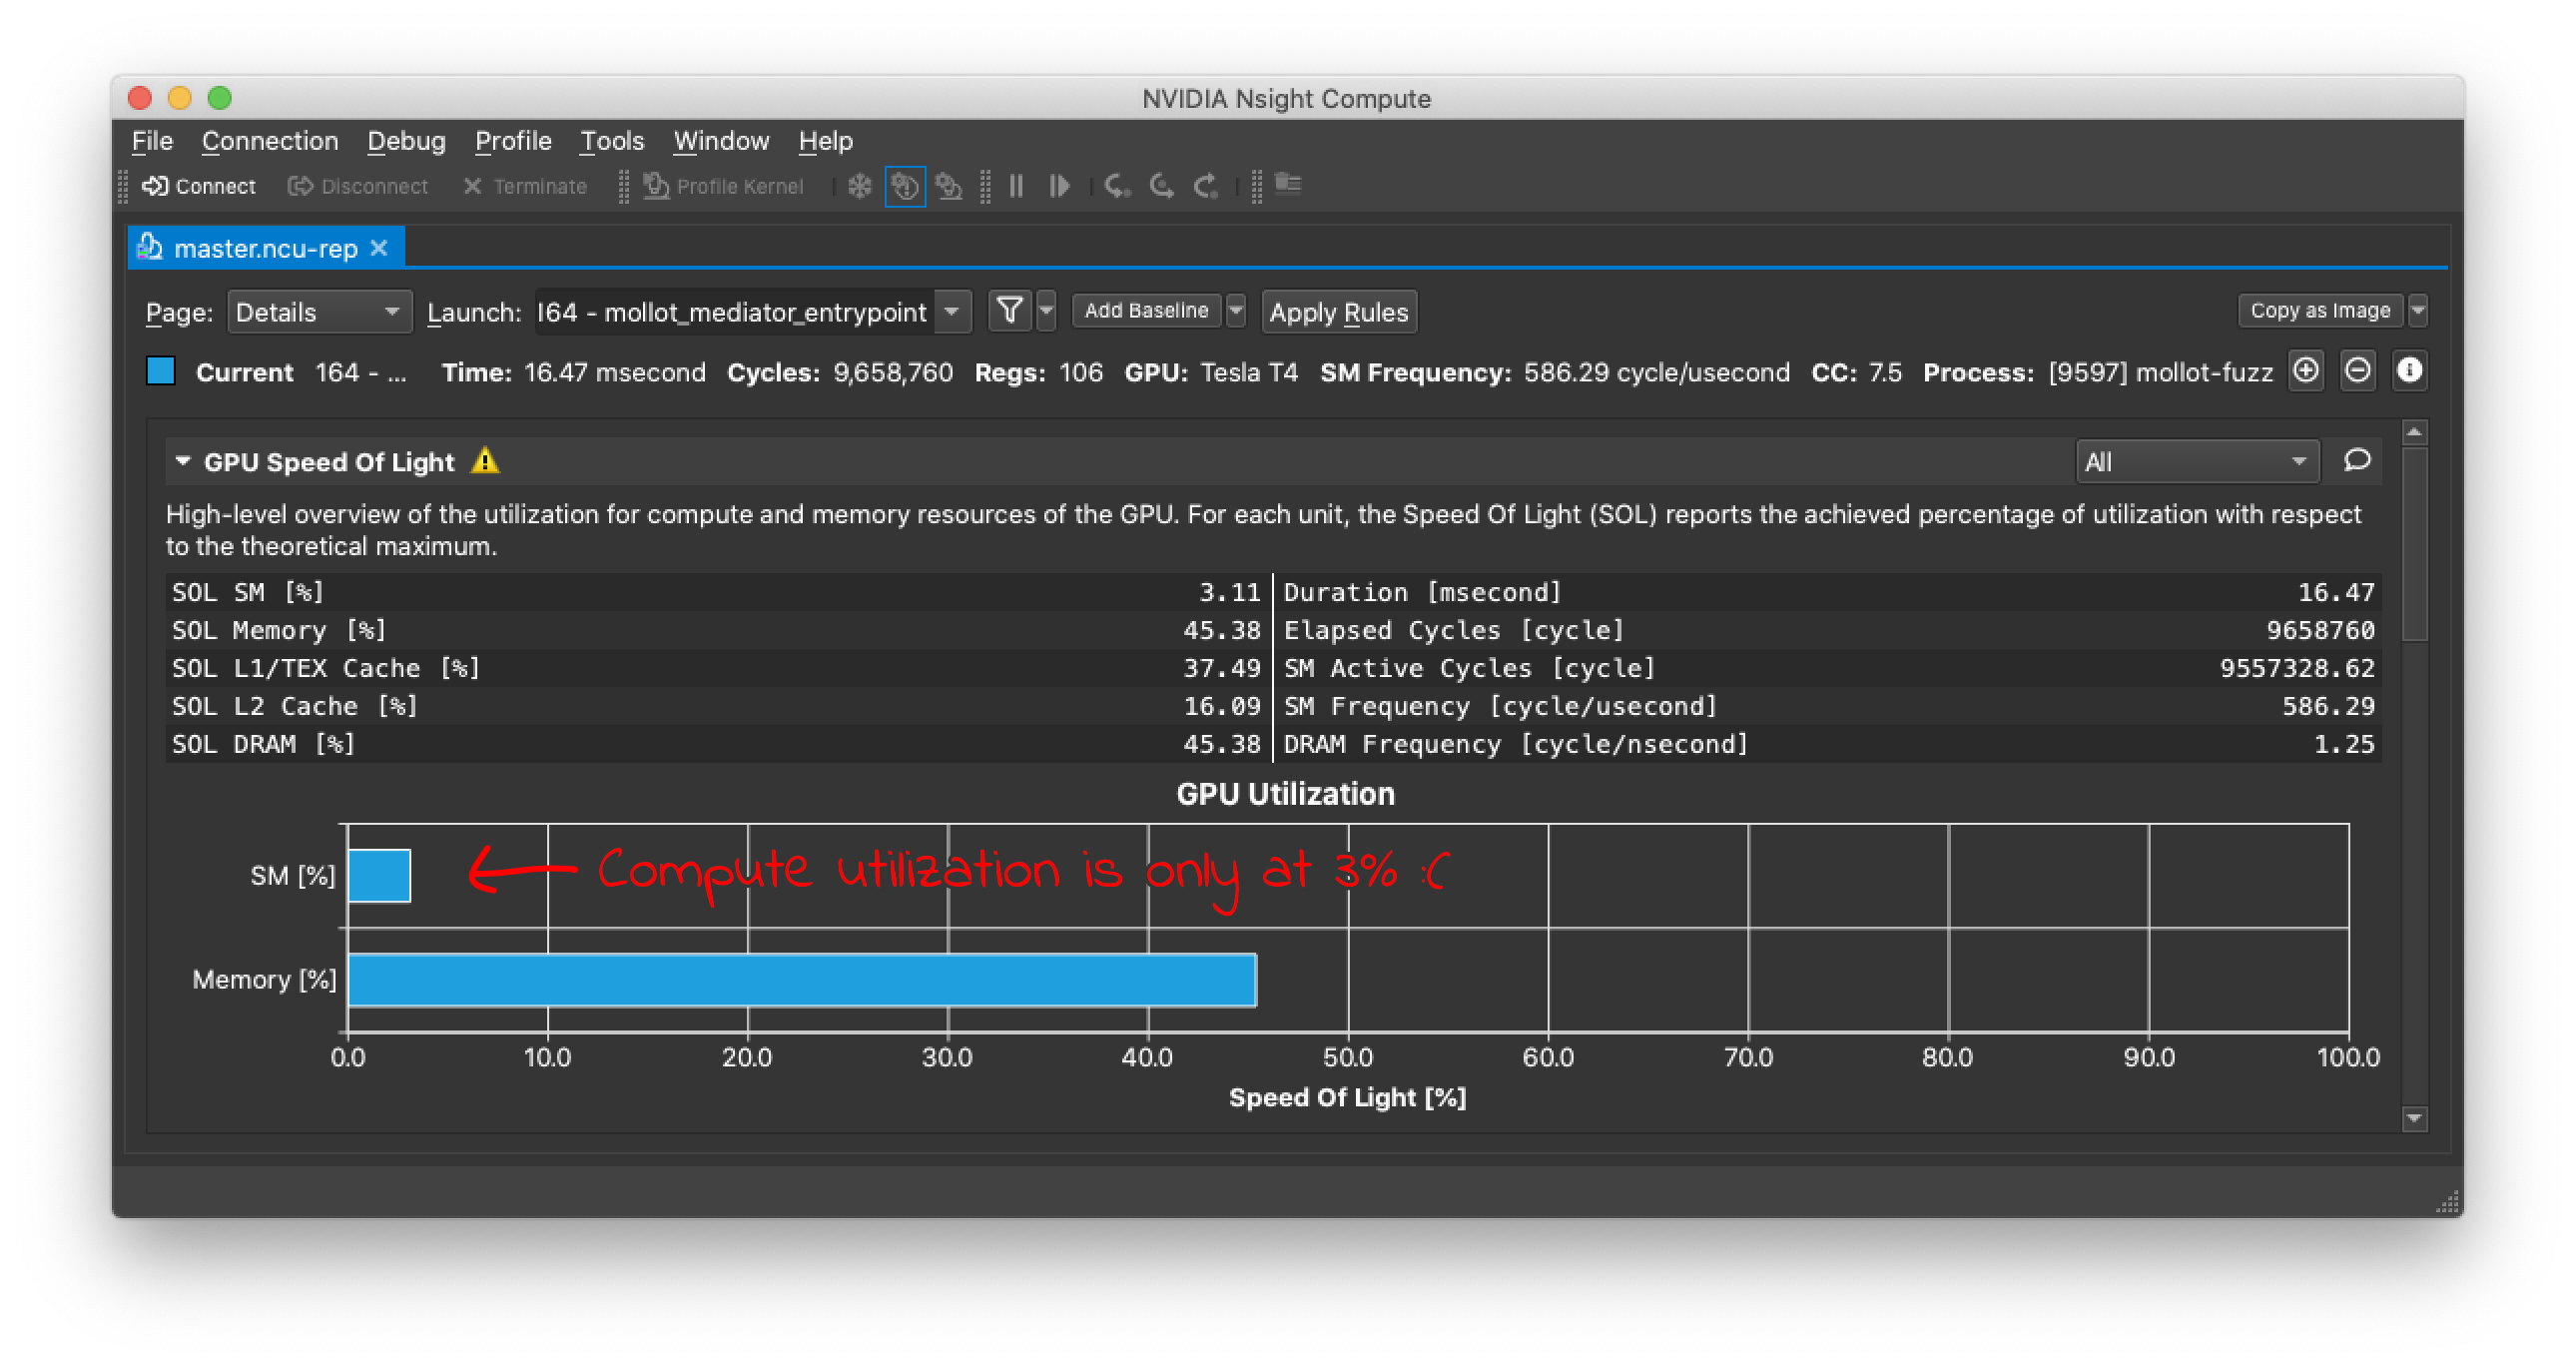
From the profile, we can see that the GPU is only using 3% of its compute capacity. Most of the time, the GPU compute hardware is sitting idle, not doing anything.
This generally happens because of high memory latency: The GPU is waiting for memory reads/writes to complete. However, this isn’t happening because our fuzzer needs to access too much memory; the profile shows that the GPU is only using 45% of its available memory bandwidth. Rather, we must be accessing memory very inefficiently. Each memory access is taking a long time and not providing enough data for computation.
To fix this problem, we need a better understanding of a GPU’s execution model.
GPU threads execute in groups of 32 called a warp. All threads in a warp execute together in a parallel multiprocessor, and they run in lockstep, i.e., they run the same instruction at the same time.
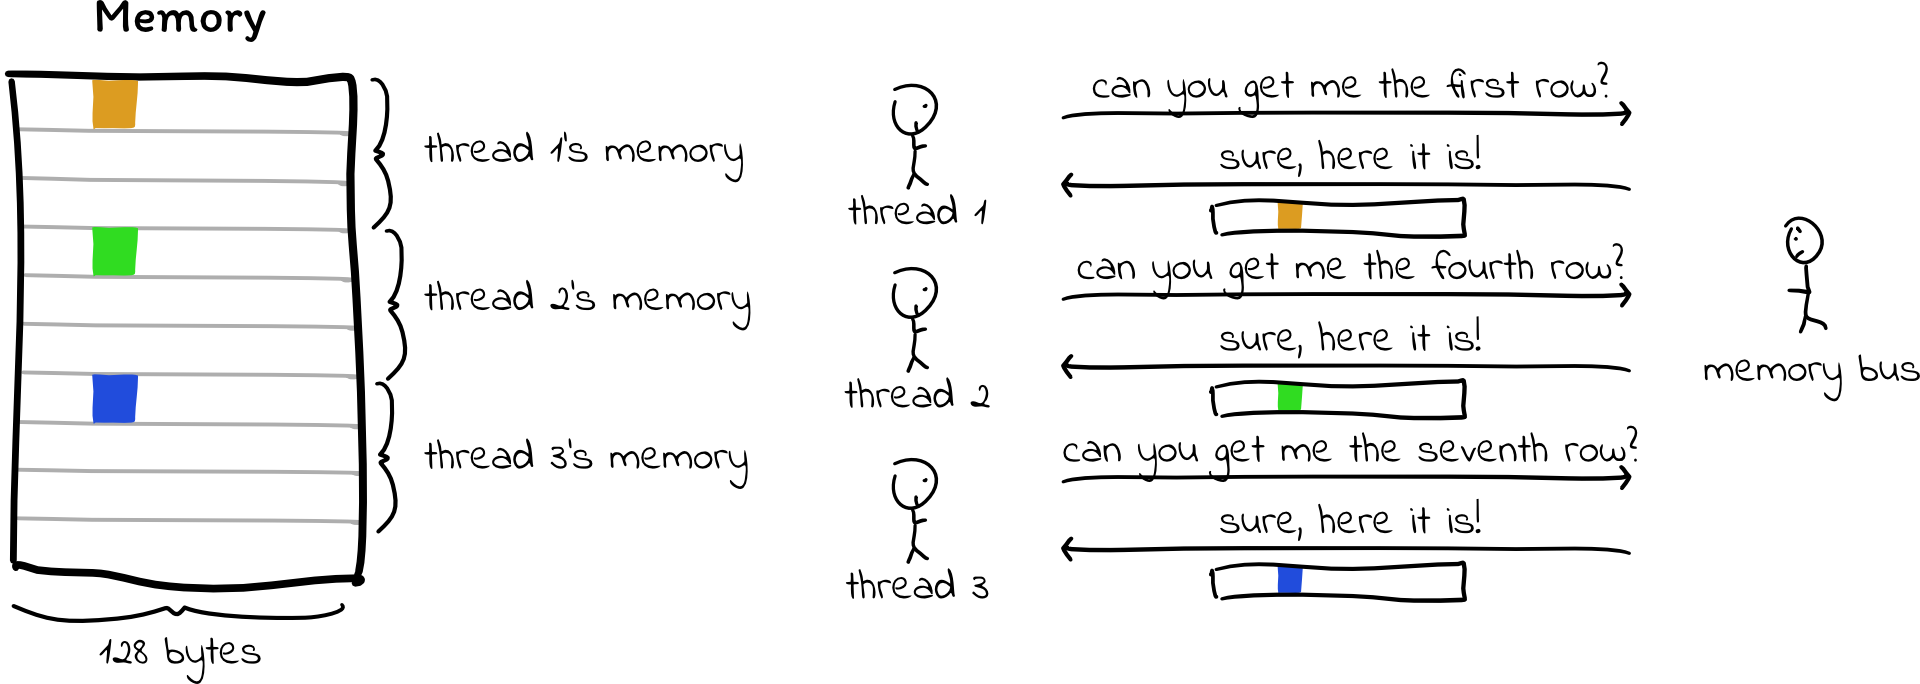
When threads read or write memory, the memory accesses happen in 128-byte blocks. If the 32 threads in the warp try to read memory that lies in the same 128-byte block, then the hardware will only need to request one block (one “transaction”) from the memory bus.
However, if the threads each read memory addresses from different blocks, the hardware may need to make 32 separate memory transactions, which are often serialized. This leads to the behavior we found in the profile: The compute hardware is almost always idle because it has to wait for so many memory transactions to complete. The memory bandwidth utilization doesn’t appear quite as bad because many 128-byte chunks are being read, but only four or eight bytes out of each chunk are actually used, so much of the used bandwidth is wasted.
Currently, we allocate separate memory for each thread, so when a thread accesses memory, it very rarely falls into the same 128-byte chunk as a different thread. We can change that by allocating a slab of memory for a warp (32 threads), and interleaving the threads’ memory within that warp. This way, when threads need to access a value from memory, their values are all next to each other, and the GPU can fulfill these memory reads with a single memory transaction.

Trying this out, we find that performance improves by an order of magnitude! Clearly, it’s extremely important to be aware of memory access patterns when programming for GPUs.
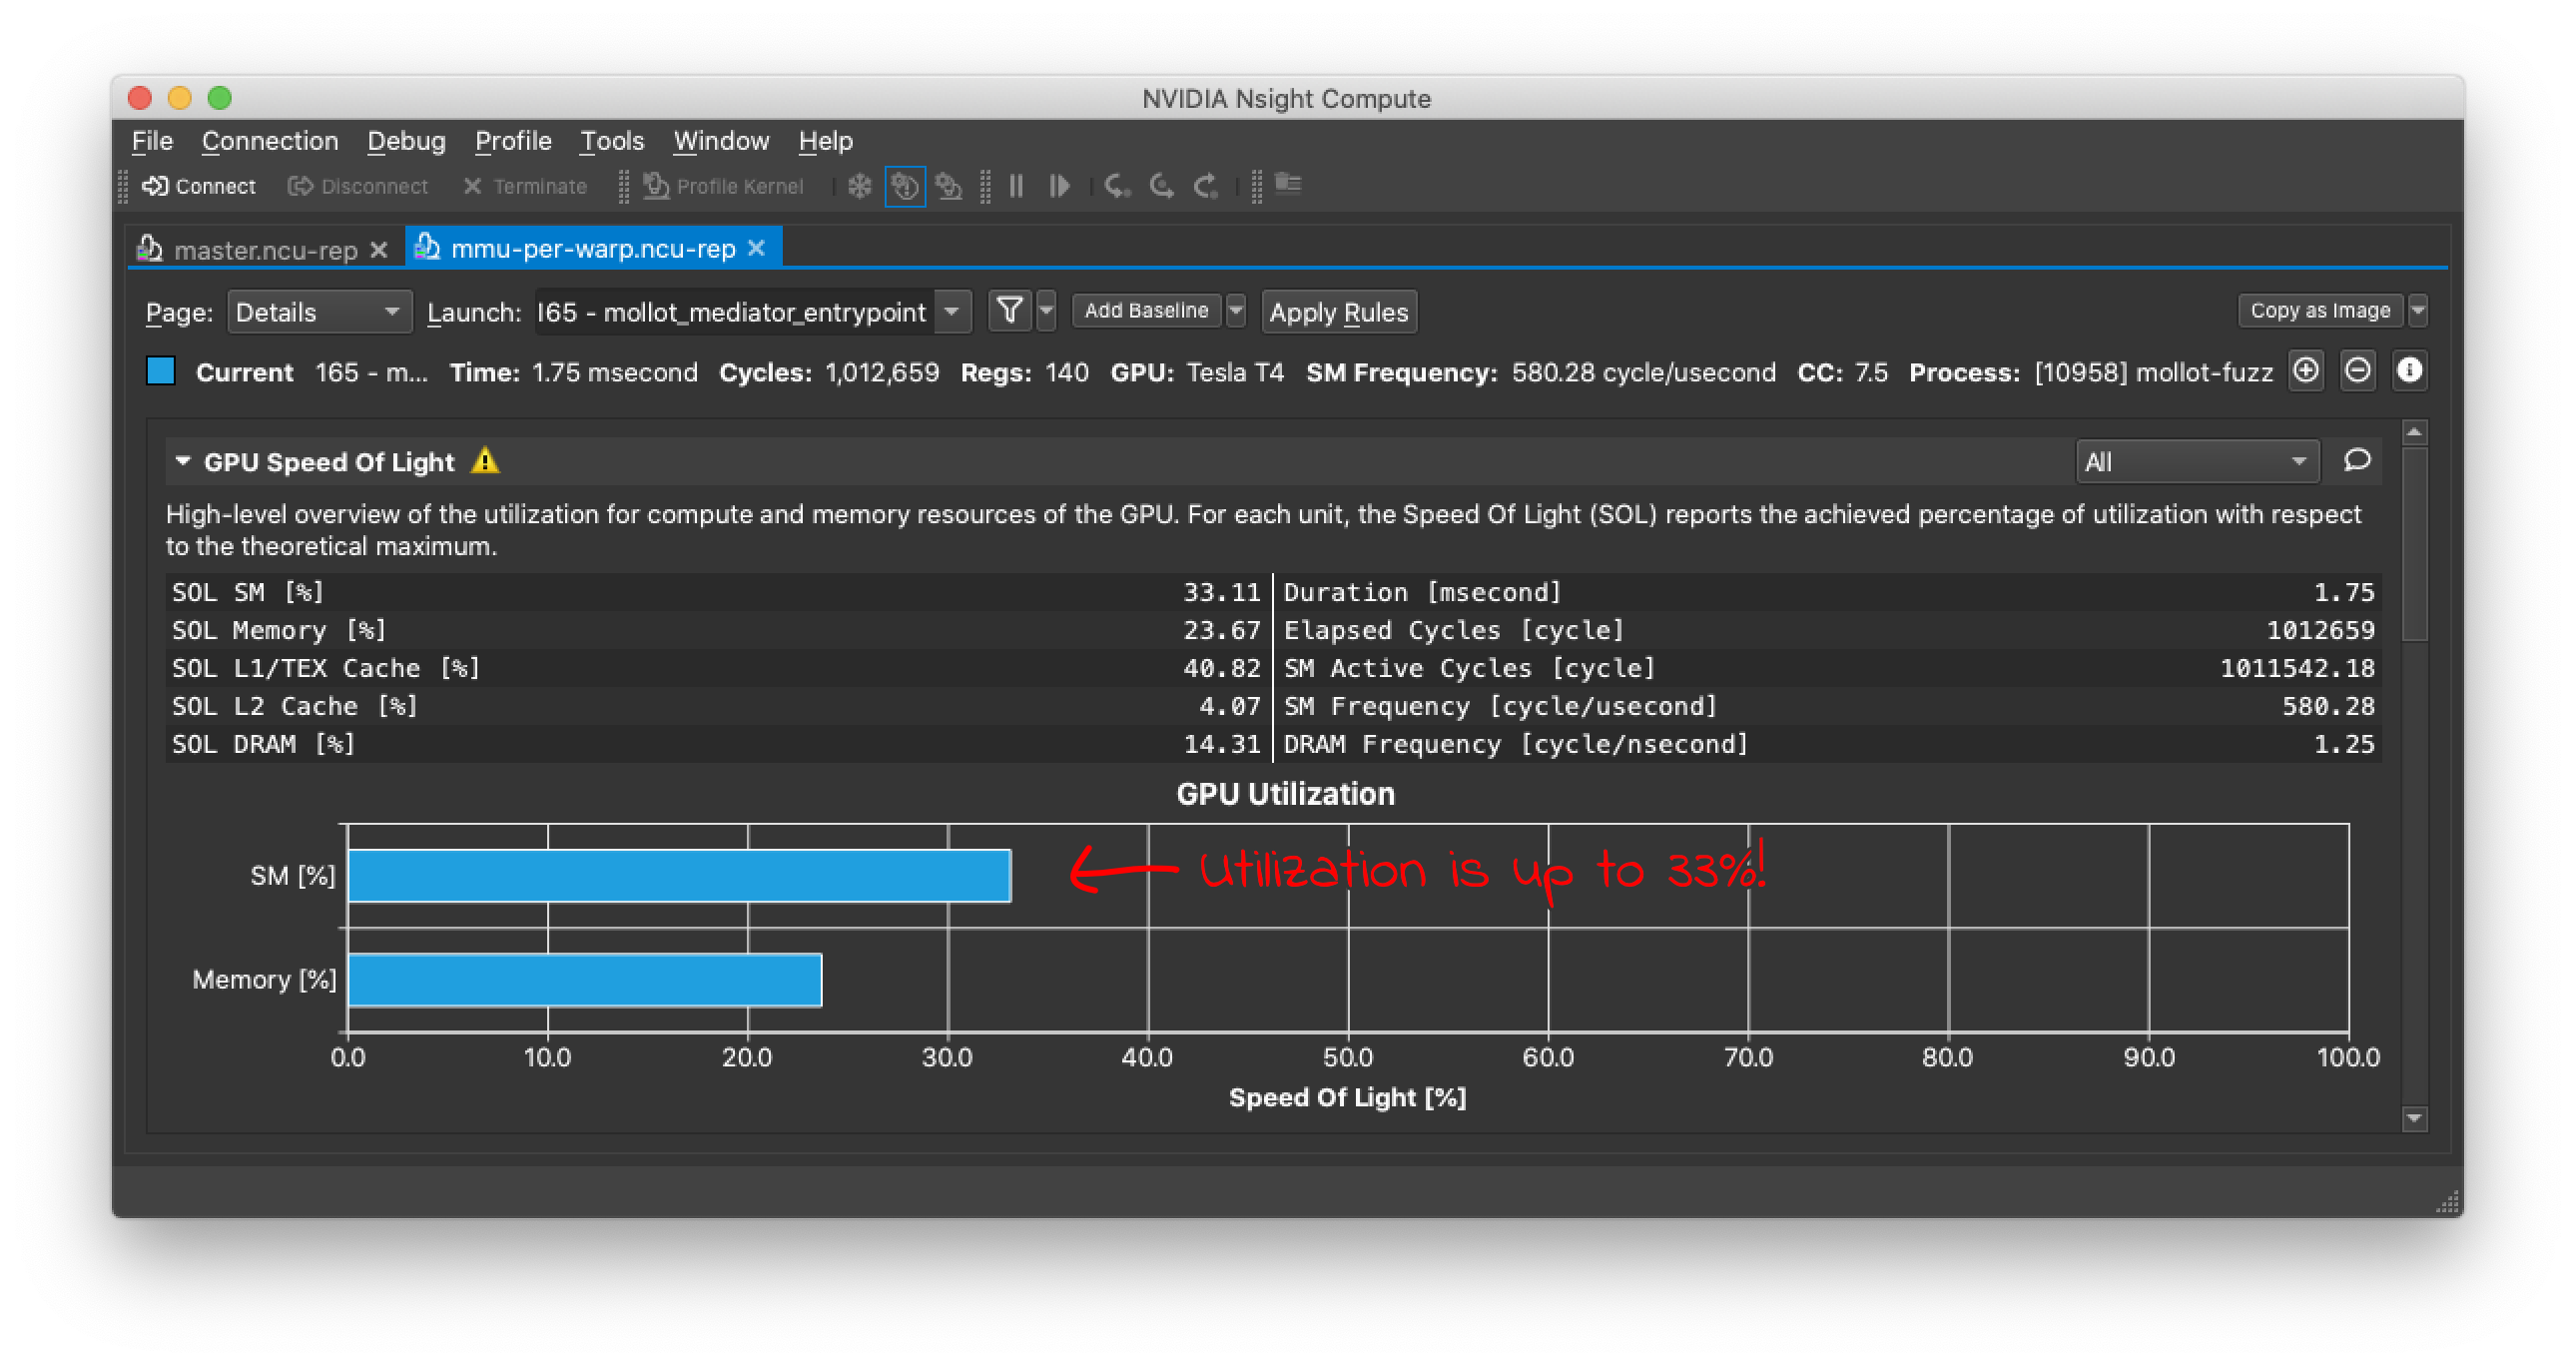
Reducing Data Transfers and Kernel Launches
Re-running the profiler, we can see that we are getting much better compute utilization (33%, up from 3%), but we are still nowhere near full utilization. Can we do better?
Continuing our examination of memory usage patterns, let’s look at the type of memory used. Nvidia GPUs have several kinds of memory located in different physical places, but the easiest type to use is called “unified memory,” which automatically transfers data between different physical locations on our behalf. We have been using this because it doesn’t require us to think much about where bytes are being physically stored, but it can lead to performance bottlenecks if mismanaged, since data will be transferred between physical memory locations inefficiently.
Since we are still seeing very high memory latency, let’s take a closer look at these transfers.
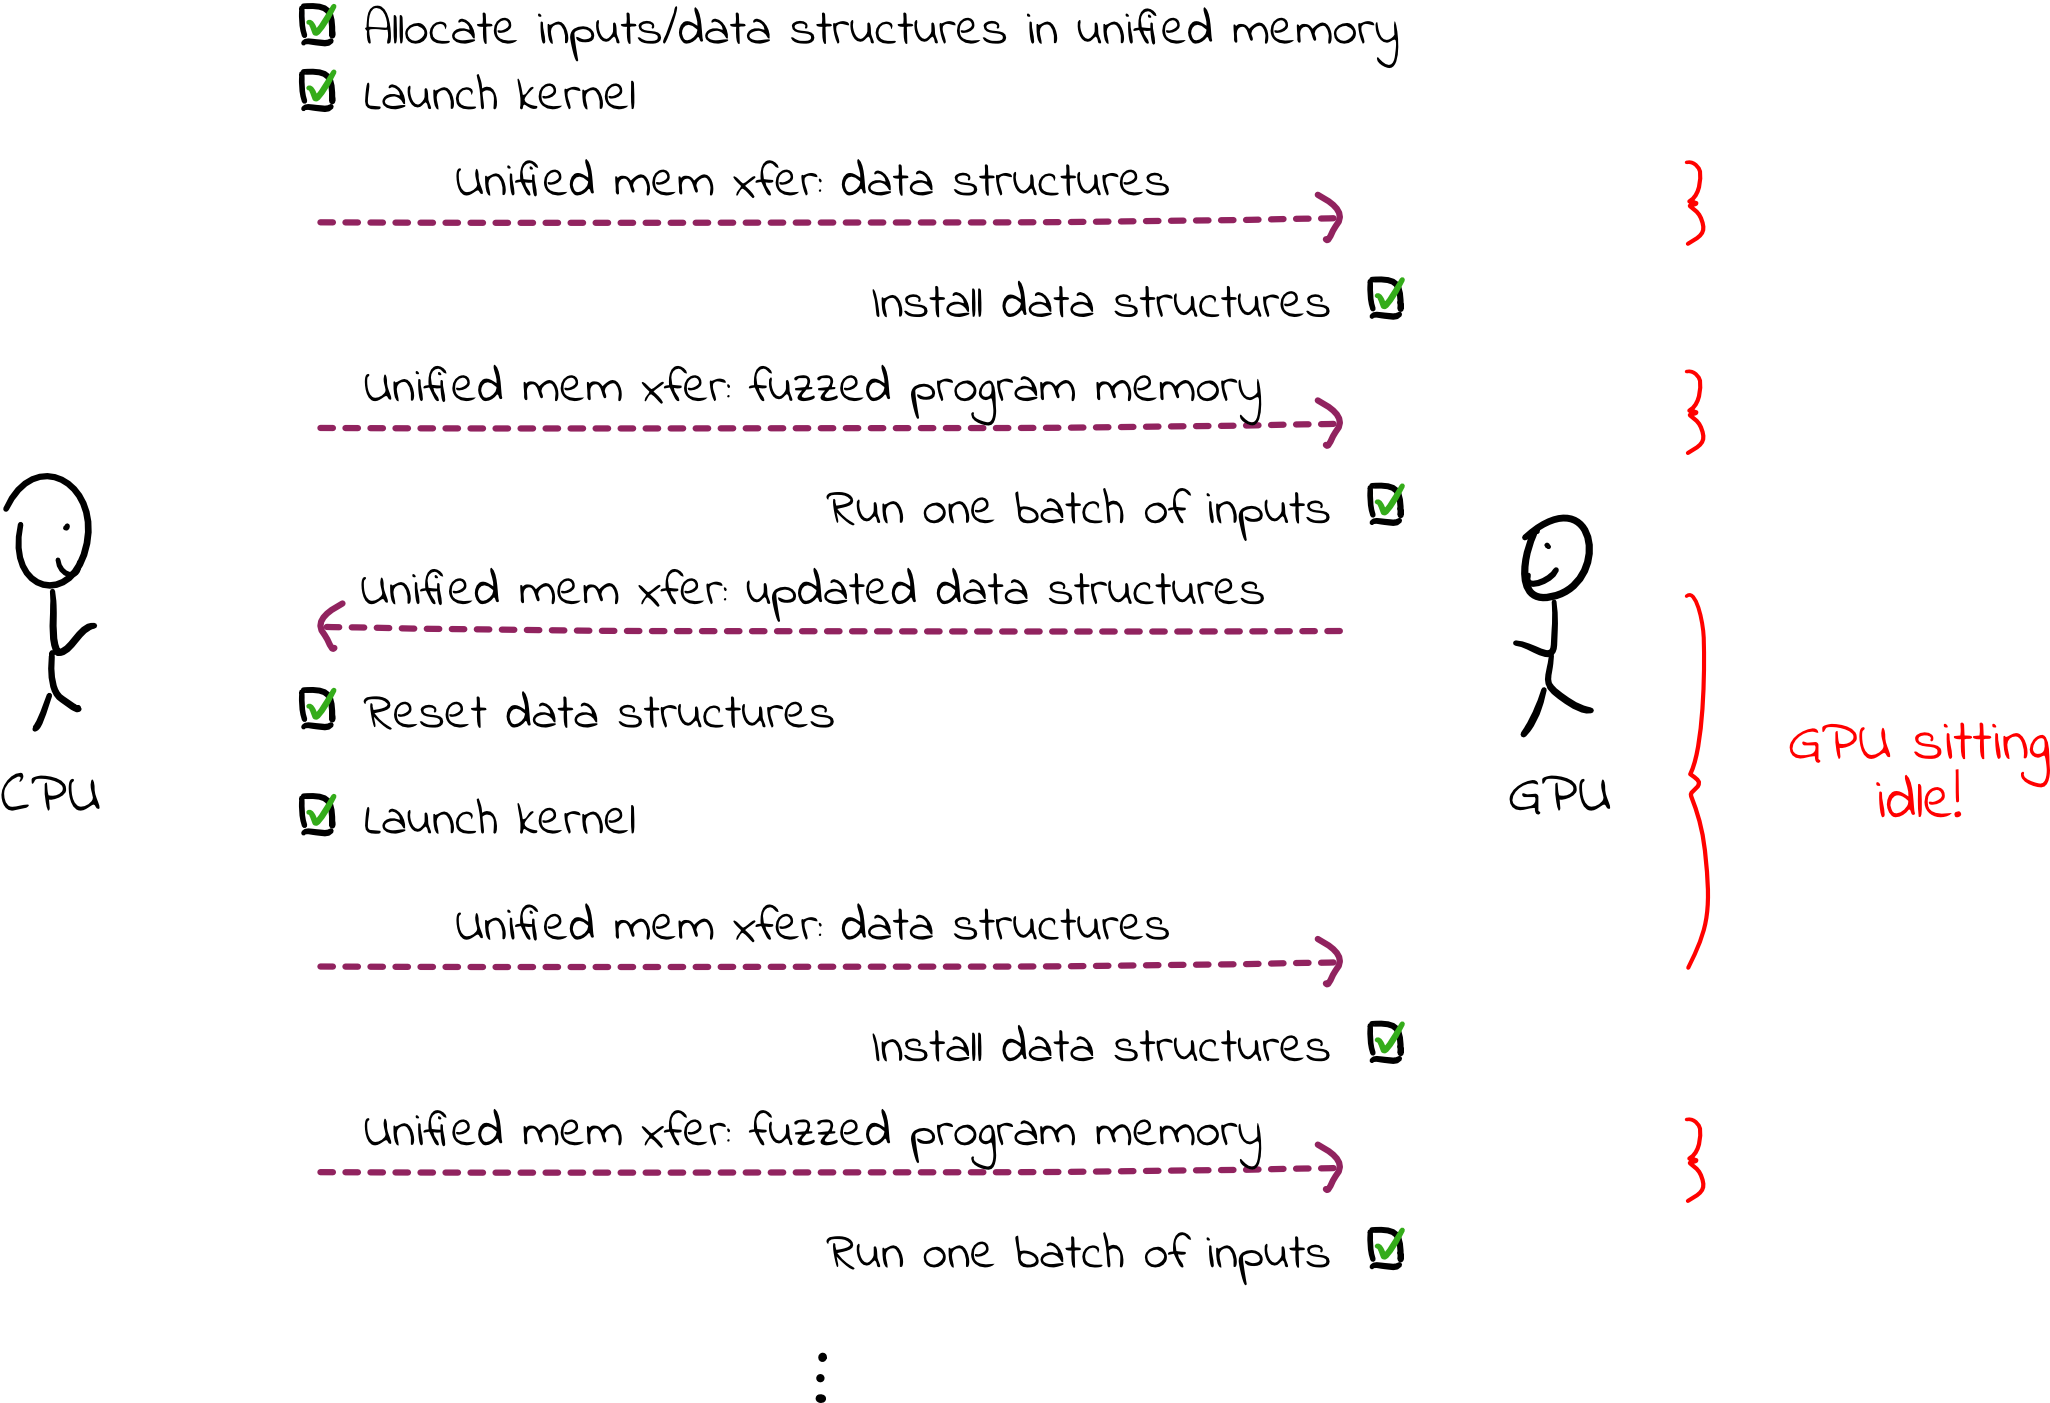
Our simple fuzzer is working in “rounds”: if the GPU can run 40,000 threads, we pass 40,000 inputs to the GPU, and each thread fuzzes an input before we launch the next round. In between rounds, we reset the memory used (e.g., coverage tracking data structures and memory used by the program being fuzzed). However, this results in significant data transfers between the GPU and the CPU in between each round, as memory is paged back to the CPU, reset, and then paged back to the GPU. While these transfers are happening, the GPU is doing nothing. Additional latency is incurred as the GPU waits for the CPU to launch the next round.
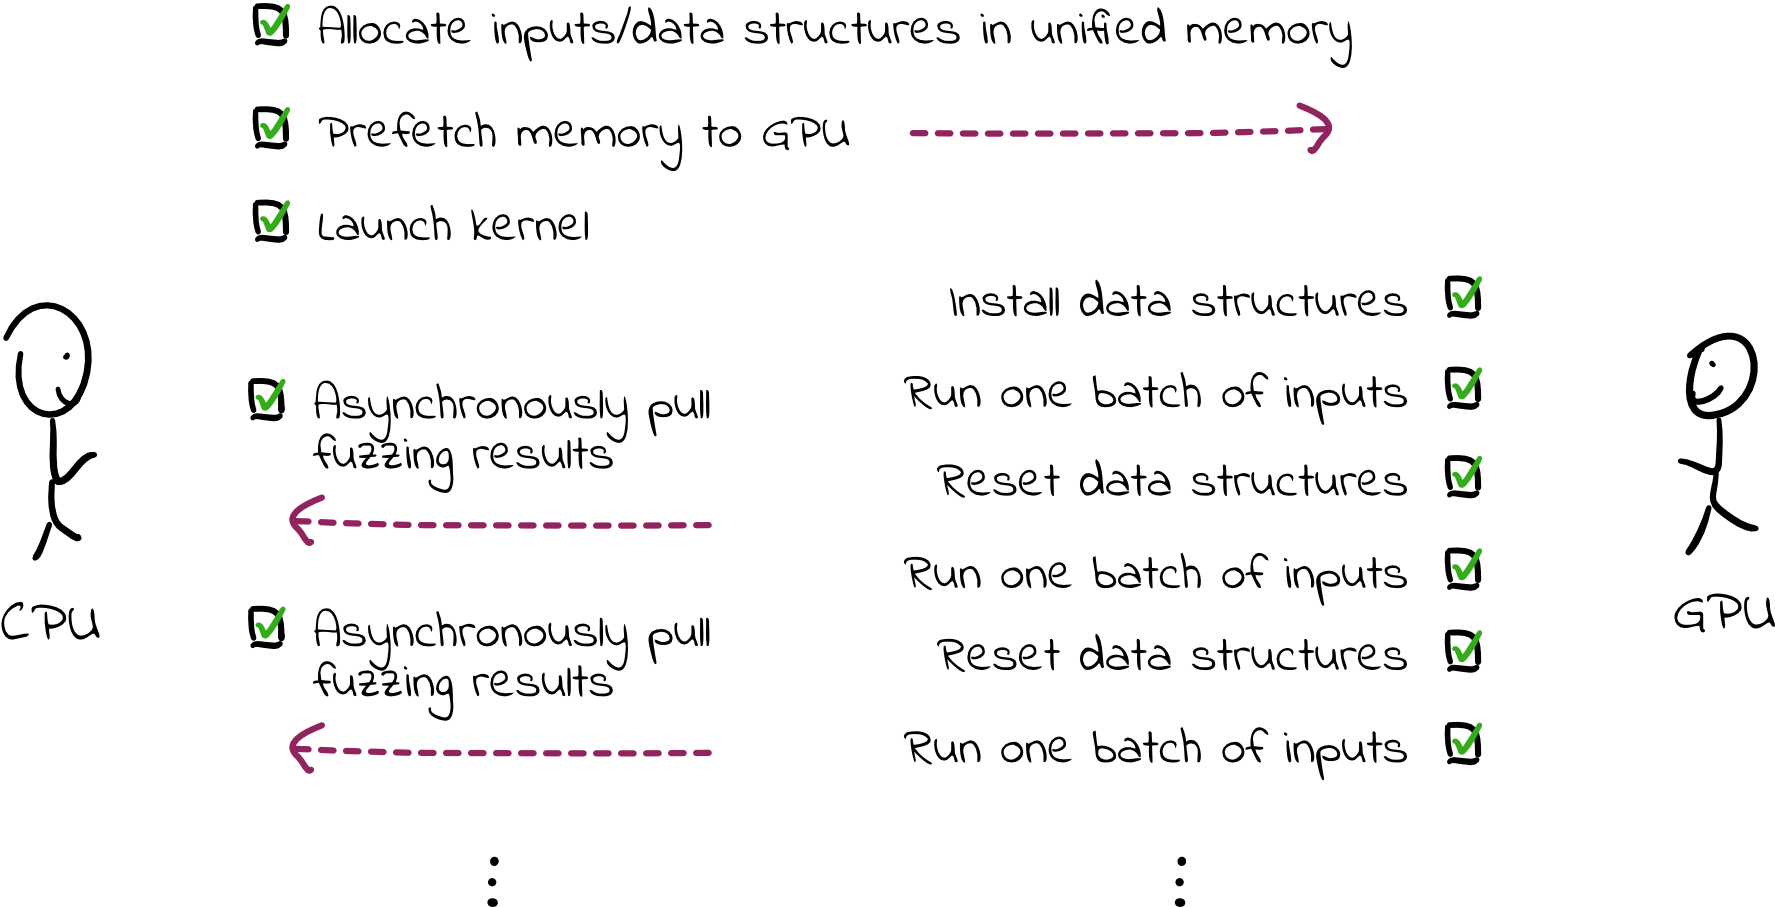
We can improve this setup by doing a single launch of the GPU code and avoiding synchronicity between the CPU and GPU. Much of the data doesn’t need to be in unified memory; we can allocate global memory on the GPU instead, then asynchronously transfer data to the CPU when we need to send information about fuzzing progress (e.g., which inputs are causing crashes). In this way, when a thread finishes fuzzing an input, it can reset the memory and proceed to the next input without data transfer overhead and without waiting on the CPU.
This achieves a speedup of almost another order of magnitude! Now, the fuzzer is about five times faster per dollar than libFuzzer.
It’s extremely promising—although our fuzzer lacks a mutation engine and can’t handle system calls, exceeding libFuzzer’s performance to this degree suggests that fuzzing using GPUs may be extremely useful for certain applications.
What’s Next for GPU-Based Fuzzing?
Although we are close to our performance goal for this very simple test program, the project still has a long way to go. Hardware utilization remains low, so there’s room for more optimization.
In addition, we need to build support for handling system calls, which may have a significant performance impact when fuzzing I/O-heavy applications. We also need to build the mutation engine before this fuzzer can be useful, although this problem is much better understood than building the execution engine.
Still, we’re very excited to be getting such promising results in such early stages of development. We look forward to an order of magnitude improvement in fuzzing embedded binaries.
We would love to hear your thoughts on this work! Contact us at [email protected] or [email protected].
Finally, a big “thank you” goes to Artem Dinaburg for the initial design of this system and for mentoring me throughout this project. Also, thank you to Peter Goodman for giving design feedback and debugging suggestions.
I'm Ryan, and I would love to hear from you. Send me an email or leave a comment below!

Interested in reading more articles like this one? Join my mailing list and I'll email you when I publish a new post! I typically post less than once a month.