Capturing HTTP/HTTPS Traffic With Tshark
I have been working on a tool that collects information about network requests to help debug failing integration tests. The tests click around a website using Selenium to make sure everything works as expected; if a test fails, network logs might help track down issues with API calls. Wireshark is helpful for analyzing HTTP requests over SSL/TLS, but I needed to figure out how to do this programmatically. Tshark is the command-line cousin of Wireshark (“terminal-shark”); it is quite a capable tool, but it took me a while to figure out how to use it for what I wanted to do.
Capturing packets
Starting a packet capture is simple. I used tcpdump for the packet capture. (tshark is capable of capturing packets as well, but it complains when run as root – for good reason – and I was too lazy to set up proper capabilities and privileges and what not ¯_(ツ)_/¯)
sudo tcpdump -i eth0 -w eth0.pcap
Then, the browser needs to be launched with the SSLKEYLOGFILE environment
variable:
SSLKEYLOGFILE=sslkeys.txt firefox
This causes the browser to log the keys/shared secrets used to encrypt SSL sessions; these can then be used by Wireshark/tshark to decrypt and analyze captured traffic.
Side note: This is really handy, but I also find it pretty creepy that by setting a simple environment variable, I’m able to log all the SSL master keys being used by without there being any warning in the browser. It looks like this may be disabled by default in future releases of Firefox (see [bug 1188657][https://bugzilla.mozilla.org/show_bug.cgi?id=1188657] and release notes for NSS 3.24), but this is still working as of Firefox 48.0.2 and Chrome 53.0.2785.101.
Analyzing the captured traffic
Here comes the fun part: figuring out how to use tshark’s somewhat-obscure command-line interface. We can get a human-readable summary listing the packets and their contents using this command:
tshark -r eth0.pcap -o "ssl.keylog_file: sslkeys.txt" -Px -Y http
The -P flag prints a summary of each packet (e.g. the first line in the code
snippet below), and the -x flag includes the hex and ASCII dump for each
packet (necessary to see the content of packets, as well as the content of
decrypted/decoded/decompressed HTTP requests). -Y http filters for packets
containing HTTP requests/responses (you can specify any Wireshark filter string
here).
This produces an output something like the following:
309   2.869081 107.170.192.171 → 10.0.4.13    HTTP 483 HTTP/1.1 200 OK  (text/html)

Frame (483 bytes):
0000  08 6d 41 d1 f6 34 e0 91 f5 61 61 34 08 00 45 00   .mA..4...aa4..E.
0010  01 d5 d6 2d 40 00 31 06 37 93 6b aa c0 ab 0a 00   [email protected].....
0020  04 0d 01 bb ec 12 3c 88 c9 17 5f 5c 5e c3 80 18   ......<..._\^...
0030  00 7b bb da 00 00 01 01 08 0a ae 0c 63 1d 17 a1   .{..........c...
0040  3c 29 41 03 10 8f bd 4d c7 c2 90 9e 73 fe 71 c2   <)A....M....s.q.
0050  31 ae 8a 2a 3f 2b 37 b9 f0 af 3a 83 28 5d 4b b9   1..*?+7...:.(]K.
<...output snipped for brevity...>
Reassembled TCP (1865 bytes):
0000  17 03 03 07 44 dd 7e a7 2c b2 c2 b5 b4 96 df ca   ....D.~.,.......
0010  38 d8 d6 c0 e8 a3 e8 d4 53 6e 9d d2 c9 79 46 b8   8.......Sn...yF.
0020  e6 dc 70 03 50 d0 0f d2 43 86 b2 2d 17 b3 f8 cb   ..p.P...C..-....
0030  cb 5d 42 4d d6 d4 35 49 a4 ec a5 f4 d0 da f9 14   .]BM..5I........
0040  69 c3 d8 d2 e5 d7 aa 8c a5 79 f4 73 40 6e 2d 72   i........y.s@n-r
0050  cb 37 42 73 04 cf 07 7c 7d 07 67 93 ca 00 5e a9   .7Bs...|}.g...^.
<...output snipped for brevity...>
Decrypted SSL data (1836 bytes):
0000  48 54 54 50 2f 31 2e 31 20 32 30 30 20 4f 4b 0d   HTTP/1.1 200 OK.
0010  0a 53 65 72 76 65 72 3a 20 6e 67 69 6e 78 2f 31   .Server: nginx/1
0020  2e 34 2e 36 20 28 55 62 75 6e 74 75 29 0d 0a 44   .4.6 (Ubuntu)..D
0030  61 74 65 3a 20 46 72 69 2c 20 30 39 20 53 65 70   ate: Fri, 09 Sep
0040  20 32 30 31 36 20 30 35 3a 32 34 3a 32 34 20 47    2016 05:24:24 G
0050  4d 54 0d 0a 43 6f 6e 74 65 6e 74 2d 54 79 70 65   MT..Content-Type
<...output snipped for brevity...>
De-chunked entity body (1546 bytes):
0000  1f 8b 08 00 00 00 00 00 00 03 b5 58 5b 6f db 36   ...........X[o.6
0010  14 7e ef af e0 b4 07 6f 98 25 25 69 b2 a2 85 e4   .~.....o.%%i....
0020  62 2b 56 34 c5 8a 16 c5 b0 b6 7b a3 a4 63 8b 31   b+V4......{..c.1
0030  25 aa 24 65 45 ff 7e 87 d4 c5 f4 dd 31 36 01 81   %.$eE.~.....16..
0040  c3 cb f9 0e 79 6e fc c8 28 d7 05 9f 3d 23 f8 45   ....yn..(...=#.E
0050  39 d0 ac fb d7 36 35 d3 1c 66 9f 5b 5a 92 3f 12   9....65..f.[Z.?.
<...output snipped for brevity...>
Uncompressed entity body (5307 bytes):
0000  3c 68 74 6d 6c 3e 0a 20 20 20 20 3c 68 65 61 64   <html>.    <head
0010  3e 0a 20 20 20 20 20 20 20 20 3c 74 69 74 6c 65   >.        <title
0020  3e 52 79 61 6e 20 45 62 65 72 68 61 72 64 74 3c   >Ryan Eberhardt<
0030  2f 74 69 74 6c 65 3e 0a 20 20 20 20 20 20 20 20   /title>.
0040  3c 6c 69 6e 6b 20 68 72 65 66 3d 27 68 74 74 70   <link href='http
0050  73 3a 2f 2f 66 6f 6e 74 73 2e 67 6f 6f 67 6c 65   s://fonts.google
<...output snipped for brevity...>

315   2.888277    10.0.4.13 → 107.170.192.171 HTTP 738 GET /assets/css/main.css HTTP/1.1

Frame (738 bytes):
0000  e0 91 f5 61 61 34 08 6d 41 d1 f6 34 08 00 45 00   ...aa4.mA..4..E.
0010  02 d4 03 10 40 00 40 06 fa b1 0a 00 04 0d 6b aa   ....@[email protected].
0020  c0 ab ec 12 01 bb 5f 5c 5e c3 3c 88 ca b8 80 18   ......_\^.<.....
0030  10 00 02 da 00 00 01 01 08 0a 17 a1 3c 9d ae 0c   ............<...
0040  63 1d 17 03 03 02 9b 00 00 00 00 00 00 00 02 55   c..............U
0050  7f f0 ee 04 c9 cf 89 e3 37 0f 61 09 a5 75 3a 55   ........7.a..u:U
...
This roughly mirrors what is shown in the Wireshark interface (I’ve highlighted text above to match the image below):
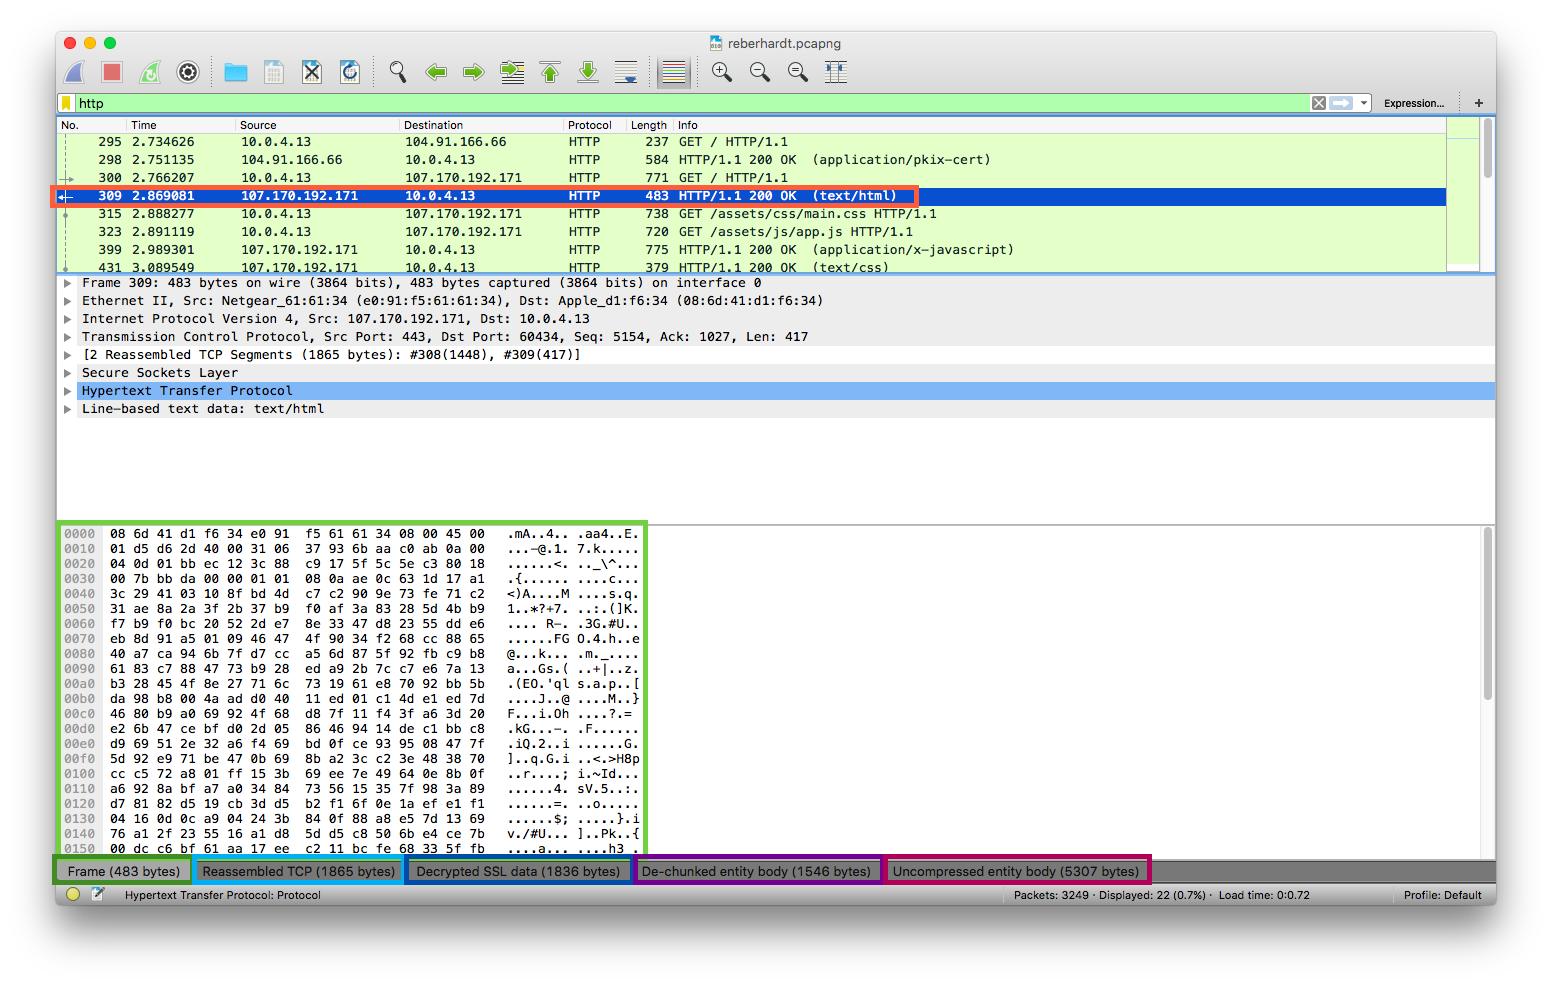
This is nice for inspecting a packet capture from the command line, but it’s no good for programmatically extracting data. We would have to parse the hex dump in order to get the request/response bodies, and this doesn’t show all the data we might need (e.g. it does not show the TCP stream number for requests, which we need in order to match responses to requests).
Using the fields format
Tshark allows us to extract specific information from a packet capture using the
fields format. For example, to get the time of each request, the TCP stream
number, the request method (if a request), the request URI (if a request), and
the response status code (if a response), we can run the following:
tshark -r eth0.pcap -o "ssl.keylog_file: sslkeys.txt" -Y http -T fields    \
    -e frame.time -e tcp.stream -e http.request.method -e http.request.uri \
    -e http.response.code
This filters for packets containing HTTP requests (-Y http), specifies that we
are interested in getting the contents of specific fields (-T fields), and
then specifies the fields we want using -e (a full list of all fields is
availalbe at https://www.wireshark.org/docs/dfref/). We get something like the following:
Sep  9, 2016 00:24:24.522377000 CDT	34	GET	/
Sep  9, 2016 00:24:24.538886000 CDT	34			200
Sep  9, 2016 00:24:24.553958000 CDT	22	GET	/
Sep  9, 2016 00:24:24.656832000 CDT	22			200
Sep  9, 2016 00:24:24.676028000 CDT	22	GET	/assets/css/main.css
Sep  9, 2016 00:24:24.678870000 CDT	24	GET	/assets/js/app.js
Sep  9, 2016 00:24:24.777052000 CDT	24			200
Sep  9, 2016 00:24:24.877300000 CDT	22			200
Sep  9, 2016 00:24:25.000625000 CDT	22	GET	/assets/img/backgrounds/DSC_9869.jpg
Sep  9, 2016 00:24:25.004634000 CDT	24	GET	/assets/img/backgrounds/DSC_5179.jpg
Sep  9, 2016 00:24:25.004856000 CDT	27	GET	/assets/img/backgrounds/DSC_9903.jpg
Sep  9, 2016 00:24:25.004984000 CDT	23	GET	/assets/img/backgrounds/intersession.jpg
Sep  9, 2016 00:24:25.005104000 CDT	26	GET	/assets/img/backgrounds/DSC_0231.jpg
Sep  9, 2016 00:24:25.005223000 CDT	25	GET	/assets/img/backgrounds/DSC_0229.jpg
Sep  9, 2016 00:24:25.798897000 CDT	26			200
Sep  9, 2016 00:24:25.944080000 CDT	25			200
Sep  9, 2016 00:24:26.049060000 CDT	24			200
Sep  9, 2016 00:24:26.427135000 CDT	22			200
Sep  9, 2016 00:24:35.180657000 CDT	65	GET	//MFgwVqADAgEAME8wTTBLMAkGBSsOAwIaBQAEFH7maudymrP8%2BKIgZGwWoS1gcQhdBBSoSmpjBH3duubRObemRWXv86jsoQISAxNGKbLxiiLRFxUBOSY7kY6x
Sep  9, 2016 00:24:35.265196000 CDT	65			200
Sep  9, 2016 00:24:38.555402000 CDT	66	GET	/MFYwVKADAgEAME0wSzBJMAkGBSsOAwIaBQAEFG%2F0aE1DEtJIYoGcwCs9Rywdii%2BmBBTEp7Gkeyxx%2BtvhS5B1%2F8QVYIWJEAIQCgFBQgAAAVOFc2oLheynCA%3D%3D
Sep  9, 2016 00:24:38.626780000 CDT	66			200
This lets us get all sorts of information, and it’s relatively easy to parse (just split on tab characters and maybe handle some edge cases). Responses can be matched to requests by the TCP stream number; for example, the second line is a response to the first line, the fourth line is a response to the third line, the eigth line is a response to the fifth line, and the seventh line is a response to the sixth line). However, I wasn’t able to figure out any way to get the request/response bodies with this method.
Using pdml
PDML (Packet Details Markup Language) is an XML-based format that stores information about decoded/analyzed packets. Arguably, this is the first thing I should have tried when looking to programmatically analyze packet info (as opposed to parsing plaintext terminal output), but a quick search didn’t turn up any solid Python PDML libraries, and since I didn’t need much info from each packet (I certainly didn’t need all the tshark/wireshark fields, which are all exported when using PDML), I wanted to try doing something simple and easy to understand before resorting to using PDML.
Since I didn’t need to get many fields, I decided to just read the PDML spec and use Python’s XML parser to get the info I needed (in favor of trying to figure out how to get parts of txshark or pdml2flow to do what I wanted).
As described in the PDML spec, the general structure of a PDML file is like this:
<pdml>
    <packet>
        <proto name="someprotocol" otherattributes...>
            <field attributes...>
                <!-- potentially nested field tags -->
            </field>
        </proto>
    </packet>
</pdml>
As you might guess, there is one <packet> tag for each packet captured. The
<proto> tags provide information about each protocol related to the packet
that Wireshark was able to detect; for example, the packets that carry the HTML
of my website have geninfo (general information), frame (Level 2 frames),
eth (ethernet), ip, tcp, ssl, and http. Packets for DNS lookups
contain geninfo, frame, eth, ip, upd, and mdns proto tags.
proto tags are required to have name (machine-readable names, such as the
ones listed in the previous sentence), showname (human-readable names),
size, and pos attributes.
Inside each <proto> tag is one or more <field> tags with the actual juicy
info that we want. There is one <field> tag per Wireshark field for each
protocol, of which there are a crapload (see the Wireshark
documentation; for example, the fields
for the http protocol are listed
here). The spec lists
several attributes for <field> tags, but name, showname, and value are
most interesting.
We can get IP/TCP/HTTP info (e.g. TCP stream number, IP source/destination
address, HTTP status code, etc) pretty easily this way. To get the HTTP
response body, we’ll want to look at the http.file_data field; the value
attribute on that <field> tag contains the raw bytes (encoded in hex) that we
can easily decode. The HTTP status line (e.g. “HTTP/1.1 200 OK” or “GET
/index.html HTTP/1.1”) is in a weird place – it’s in a nameless field,
<field name="">, in the http proto – but we can get that too.
Based on this, I wrote the following quick-n-dirty solution:
import json
import pprint
import re
import sys
import xml.etree.cElementTree

def get_proto_info(proto):
    """Extract info from <proto> tags"""
    proto_name = dict(proto.items())['name']
    fields = {}
    for field in proto.getchildren():
        as_dict = dict(field.items())
        # Store both the `show` and `value` attributes. In most cases, `show`
        # is all we'll need, but sometimes we need the raw `value` (e.g. when
        # getting the raw bytes of an HTTP response body)
        fields[as_dict['name']] = (as_dict['show'], as_dict['value'])
    return (proto_name, fields)

def get_packet_info(packet):
    """Extract info from <packet> tags"""
    return dict([get_proto_info(proto) for proto in packet.getchildren()])

def get_field(packet_info, key, *args):
    """Get the value of a specific wireshark field, given a packet dictionary
    (as returned by get_packet_info()) and the name of the field (e.g.
    "ip.src")

    A single extra argument can be provided as a default value if the field is
    not found.
    """
    if len(args) > 1:
        raise TypeError('get_field was passed too many arguments')

    try:
        return packet_info[key.split('.', 1)[0]][key][0]
    except KeyError, IndexError:
        if args:
            return args[0]
        else:
            raise

def packet_is_http_request(packet_info):
    return bool(get_field(packet_info, 'http.request', False))

def packet_is_http_response(packet_info):
    return bool(get_field(packet_info, 'http.response', False))

def read_requests_from_pdml(filename):
    pcap = xml.etree.cElementTree.parse(filename).getroot()

    packets = [get_packet_info(packet) for packet in pcap.getchildren()]

    requests = []
    open_tcp_streams = {}

    for packet in [p for p in packets if 'tcp' in p]:
        if packet_is_request(packet):
            as_dict = {
                'method': get_field(packet, 'http.request.method',
                'url': get_field(packet, 'http.request.full_uri'),
                'time_relative': float(get_field(packet, 'frame.time_relative')),
                'response': None
            }
            requests.append(as_dict)

            # We're going to add this request to the list of open TCP streams.
            # When a response comes in with the same stream number, we'll know
            # it's a response to this request.
            open_tcp_streams[get_field(packet, 'tcp.stream')] = as_dict

        elif packet_is_response(packet):
            tcp_stream = get_field(packet, 'tcp.stream')
            # We're going to find the request that has this stream number, and
            # update it with the response
            if tcp_stream in open_tcp_streams:
                response = {
                    'time_relative': float(get_field(packet,
                        'frame.time_relative')),
                    'status_code': get_field(packet, 'http.response.code'),
                    'status_phrase': get_field(packet, 'http.response.phrase'),
                    'body': packet['http']['http.file_data'][1].decode('hex'),
                }
                open_tcp_streams[tcp_stream]['response'] = response
                open_tcp_streams.pop(tcp_stream)
    return requests

if __name__ == '__main__':
    print json.dump(read_requests_from_pdml(sys.argv[1]), indent=4)
New: Using json
When I was doing this work initially, there was no JSON output, but it looks like a JSON formatter has been added as of the writing of this blog post. The output structure looks similar in principle to the PDML structure, but using JSON objects instead of XML tags. If I were to do this again, I would definitely look at using the JSON output instead of using PDML.
[
  {
    "_index": "packets-2016-10-11",
    "_type": "pcap_file",
    "_score": null,
    "_source": {
      "layers": {
        "frame": {
          "frame.interface_id": "0",
          "frame.encap_type": "1",
          "frame.time": "Sep  8, 2016 22:24:21.787751000 PDT",
          "frame.offset_shift": "0.000000000",
          "frame.time_epoch": "1473398661.787751000",
          "frame.time_delta": "0.000000000",
          "frame.time_delta_displayed": "0.000000000",
          "frame.time_relative": "0.000000000",
          "frame.number": "1",
          "frame.len": "112",
          "frame.cap_len": "112",
          "frame.marked": "0",
          "frame.ignored": "0",
          "frame.protocols": "eth:ethertype:ip:tcp:ssl"
        },
        "eth": {
          "eth.dst": {
            "eth.dst_resolved": "Apple_d1:f6:34",
            "eth.addr": "08:6d:41:d1:f6:34",
            "eth.addr_resolved": "Apple_d1:f6:34",
            "eth.lg": "0",
            "eth.ig": "0"
          },
          "eth.src": {
            "eth.src_resolved": "Netgear_61:61:34",
            "eth.addr": "e0:91:f5:61:61:34",
            "eth.addr_resolved": "Netgear_61:61:34",
            "eth.lg": "0",
            "eth.ig": "0"
          },
          "eth.type": "0x00000800"
        },
        "ip": {
          "ip.version": "4",
          "ip.hdr_len": "20",
          "ip.dsfield": {
            "ip.dsfield.dscp": "0",
            "ip.dsfield.ecn": "0"
          },
          "ip.len": "98",
          "ip.id": "0x000064f3",
          "ip.flags": {
            "ip.flags.rb": "0",
            "ip.flags.df": "1",
            "ip.flags.mf": "0"
          },
          "ip.frag_offset": "0",
          "ip.ttl": "53",
          "ip.proto": "6",
          "ip.checksum": "0x0000828f",
          "ip.checksum.status": "2",
          "ip.src": "23.253.56.10",
          "ip.addr": "23.253.56.10",
...
Conclusion
Tshark documentation is really not the best ಥ_ಥ However, extracting data is actually not that hard once you know what you’re looking for. With the addition of the json formatter, it should be quite easy to get whatever info you want. Hopefully this post helps point you in the right direction!
I'm Ryan, and I would love to hear from you. Send me an email or leave a comment below!

Interested in reading more articles like this one? Join my mailing list and I'll email you when I publish a new post! I typically post less than once a month.